 Markers:
Show
Hide
Markers:
Show
Hide
Mouse-over the markers to view the TC name, click the marker to load the individual map.
| Tropical Cyclones
[Index] | Australian Region Tropical Cyclone Season 2024-2025 | ||
| Season 2024-2025 Summaries: [BoM-AU] | |||
|
Mouse-over the markers to view the TC name, click the marker to load the individual map.
Markers:
Show
Hide
|
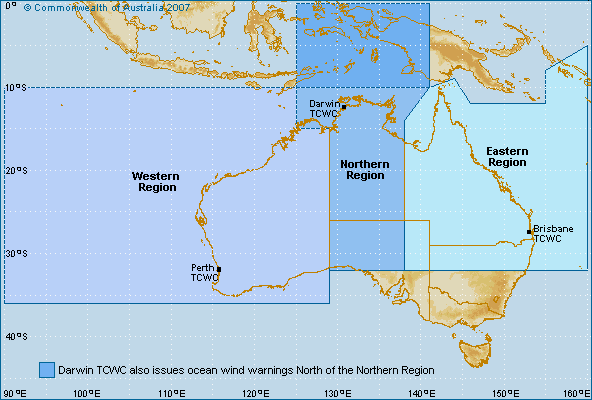
Bureau of Meteorology (BoM) Tropical Cyclone Data
Generally includes all tropical cyclones if the track commenced or moved into the Australian warning areas (between 90 E and 160 E). |
| Cyclone Name | Map ID |
Cyclone Number |
Basin | Date Range (UTC) | Min CP |
Max Winds |
Tracking Map and data |
|---|---|---|---|---|---|---|---|
| ROBYN | 1 | 1085 / 202425_01 | SIO | 23 Nov 2024 - 01 Dec 2024 | 985 | 55 | Tropical Cyclone ROBYN |
| 202425_07 | 2 | 1086 / 202425_07 | SIO | 24 Dec 2024 - 31 Dec 2024 | 999 | 35 | Tropical Cyclone 202425_07 |
| 202425_09 | 3 | 1087 / 202425_09 | SIO | 08 Jan 2025 - 13 Jan 2025 | 1000 | 40 | Tropical Cyclone 202425_09 |
| SEAN | 4 | 1088 / 202425_11 | SIO | 17 Jan 2025 - 23 Jan 2025 | 942 | 95 | Tropical Cyclone SEAN |
| TALIAH | 5 | 1089 / 202425_14 | SIO | 31 Jan 2025 - 12 Feb 2025 | 964 | 75 | Tropical Cyclone TALIAH |
| VINCE | 6 | 1090 / 202425_15 | SIO | 31 Jan 2025 - 04 Feb 2025 | 968 | 80 | Tropical Cyclone VINCE |
| ZELIA | 7 | 1091 / 202425_18 | SIO | 08 Feb 2025 - 14 Feb 2025 | 927 | 115 | Tropical Cyclone ZELIA |
| BIANCA | 8 | 1092 / 202425_21 | SIO | 19 Feb 2025 - 27 Feb 2025 | 954 | 95 | Tropical Cyclone BIANCA |
| ALFRED | 9 | 1093 / 202425_22 | SPAC | 21 Feb 2025 - 08 Mar 2025 | 954 | 90 | Tropical Cyclone ALFRED |
| 202425_25 | 10 | 1094 / 202425_25 | SIO | 17 Mar 2025 - 25 Mar 2025 | 991 | 45 | Tropical Cyclone 202425_25 |
| COURTNEY | 11 | 1095 / 202425_27 | SIO | 22 Mar 2025 - 29 Mar 2025 | 934 | 110 | Tropical Cyclone COURTNEY |
| DIANNE | 12 | 1096 / 202425_28 | SIO | 26 Mar 2025 - 30 Mar 2025 | 984 | 50 | Tropical Cyclone DIANNE |
| ERROL | 13 | 1097 / 202425_29 | SIO | 09 Apr 2025 - 18 Apr 2025 | 936 | 110 | Tropical Cyclone ERROL |
| 202425_30 | 14 | 1098 / 202425_30 | both | 16 Apr 2025 - 23 Apr 2025 | 998 | 35 | Tropical Cyclone 202425_30 |
| 202425_33 | 15 | 1099 / 202425_33 | SPAC | 09 May 2025 - 12 May 2025 | 1000 | 35 | Tropical Cyclone 202425_33 |
Minimum central pressure (CP) in hPa. Maximum winds are 10-min average in knots.
Tropical cyclone tracks developed by Michael Bath using data from the Bureau of Meteorology and Google Maps.
|
Document: bom_2024_2025_australian_region_tropical_cyclones.htm
Updated: 6 February 2026 [Australian Severe Weather index] [Copyright Notice] [Email Contacts] [Search This Site] [Privacy Policy] |