and Chasing
[Index][Archives]
Sydney Flash Flood - Sunday 26th February 2006
Report compiled by Jimmy Deguara and Michael Bath
| Storm News and Chasing [Index][Archives] |
Sydney Flash Flood - Sunday 26th February 2006 Report compiled by Jimmy Deguara and Michael Bath |
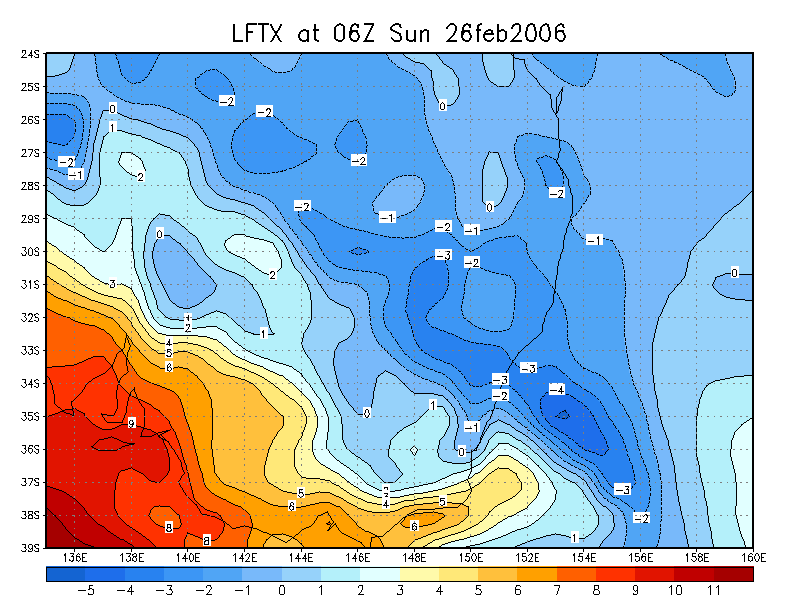
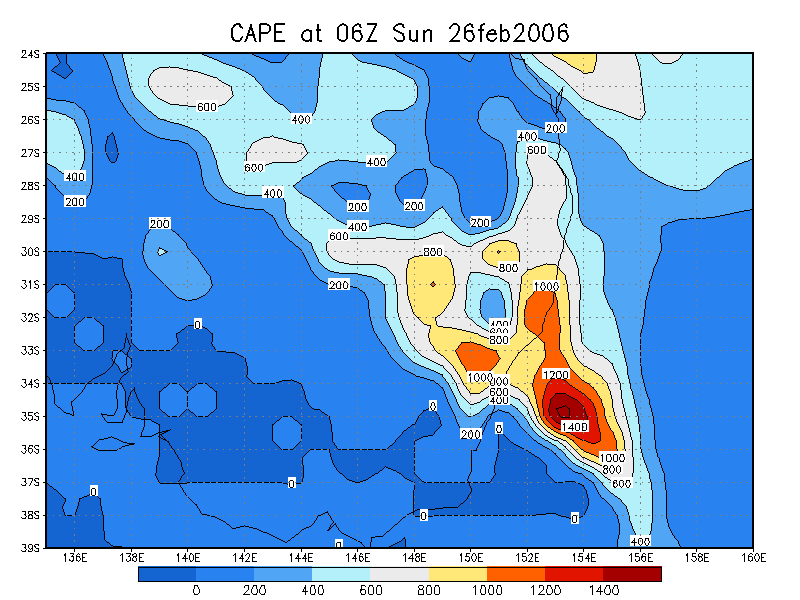
Instability was sufficient for strong to severe storms given model CAPE of 1100J/kg based on the 12Z GFS data. The 00Z data had dropped this to 600J/kg but this still was sufficient for strong to severe storms given the localised convergence. Surface lifted index over the region were -2 to -3 according to the models. The focus for development was a combination of an approaching upper trough and southerly change producing a convergence line that remained slow moving throughout the evening and night period.
I chased locally waiting until late afternoon as was the plan. An interesting base developed near Richmond which acted odd compared to other activity or let's say anticipated activity based on the models. This was the key that set the scene for conditions we experienced. After a little timelapse of this I headed into the mountains via the Bell Line of Road briefly, but there were no opportunities to film the nice base and updraft west of Mt Tomah so I headed back immediately near the Sydney Basin.
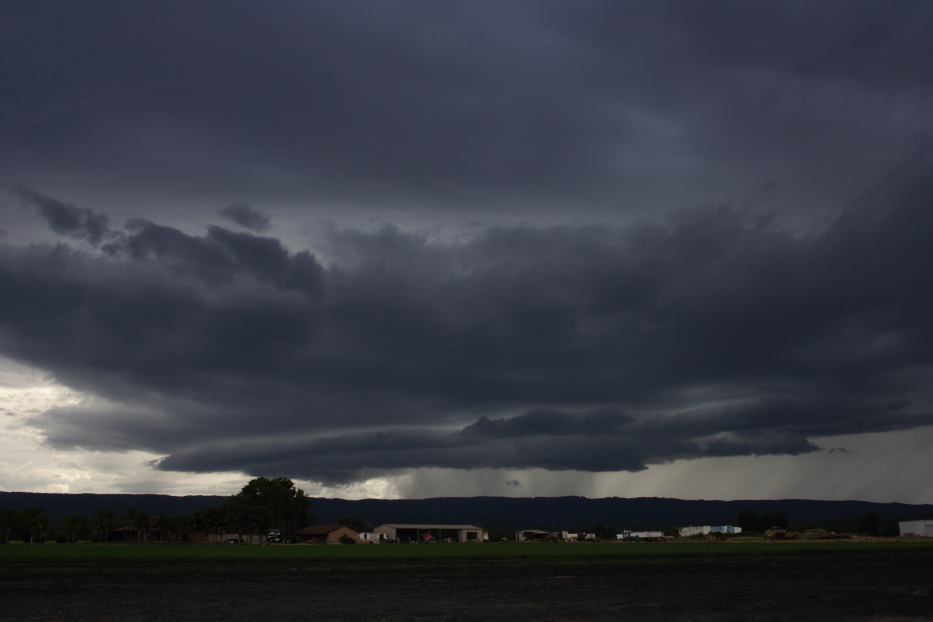
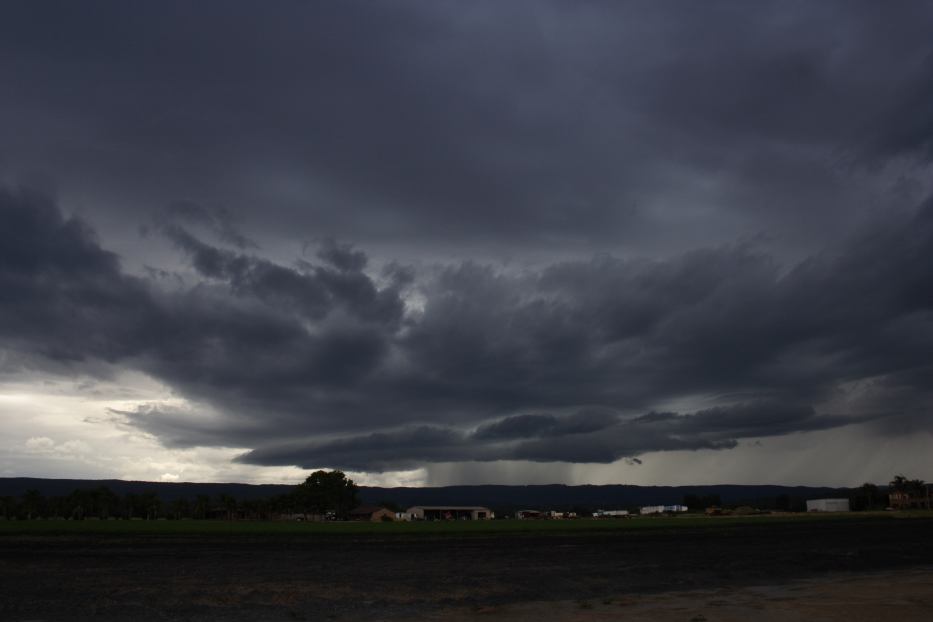
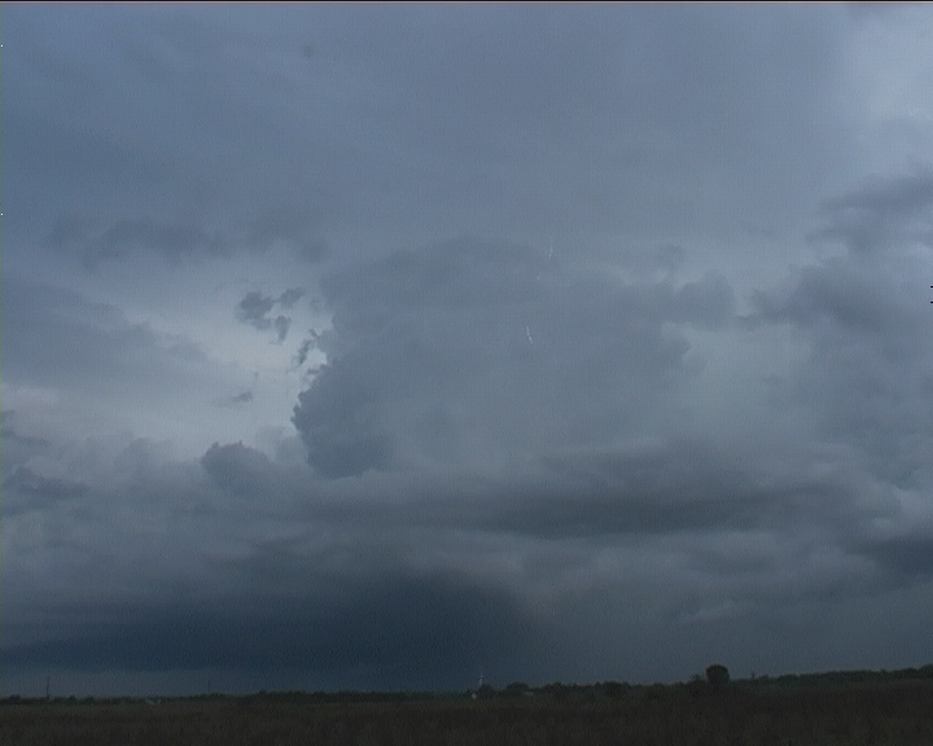
An impressive line of convergence began to develop and became my focus. I timelapsed the same storm from the back which was slowly intensifying but also backbuilding to a stationary position in the area. With the storm raining on me from the west, I headed down to near Richmond. The storm here was quite impressive providing a vrief opportunity to film. I noted NE winds at my location knowing that winds on the other side would have been SE.
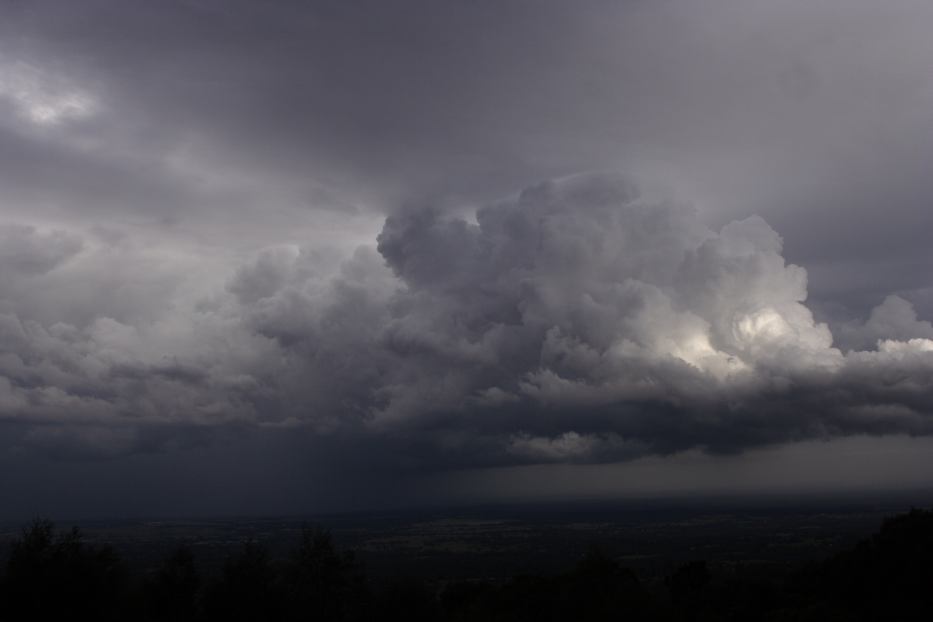
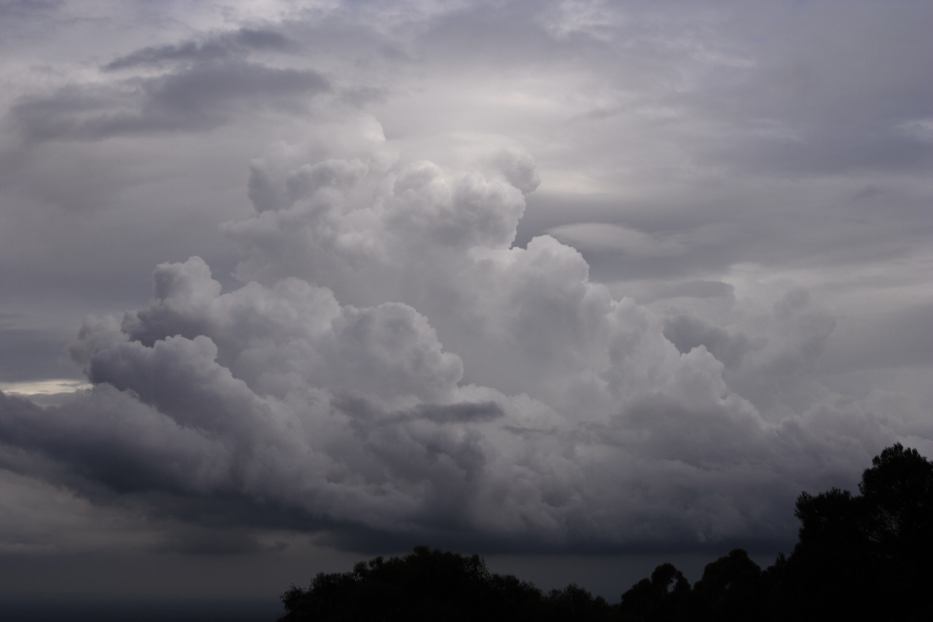
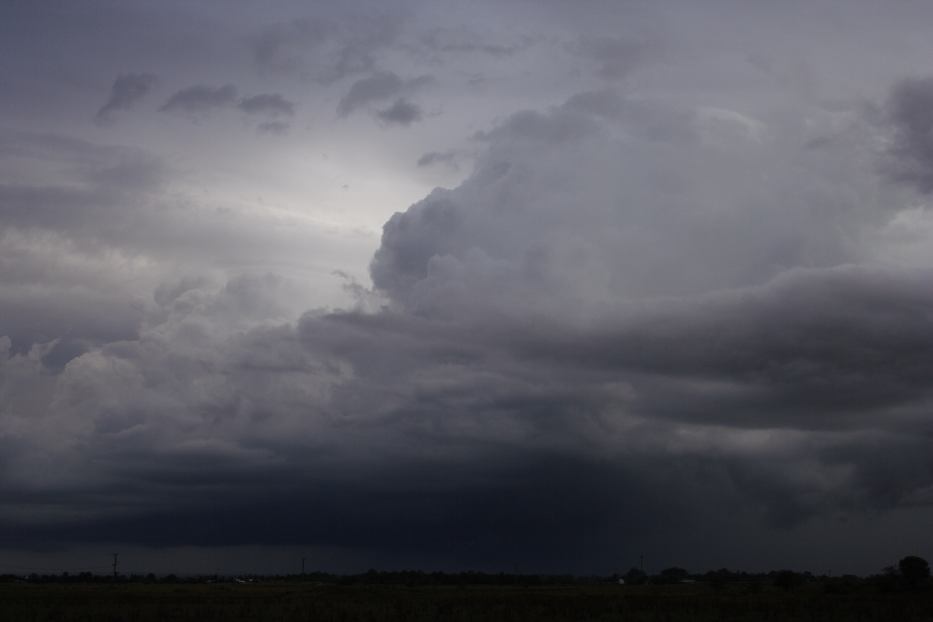
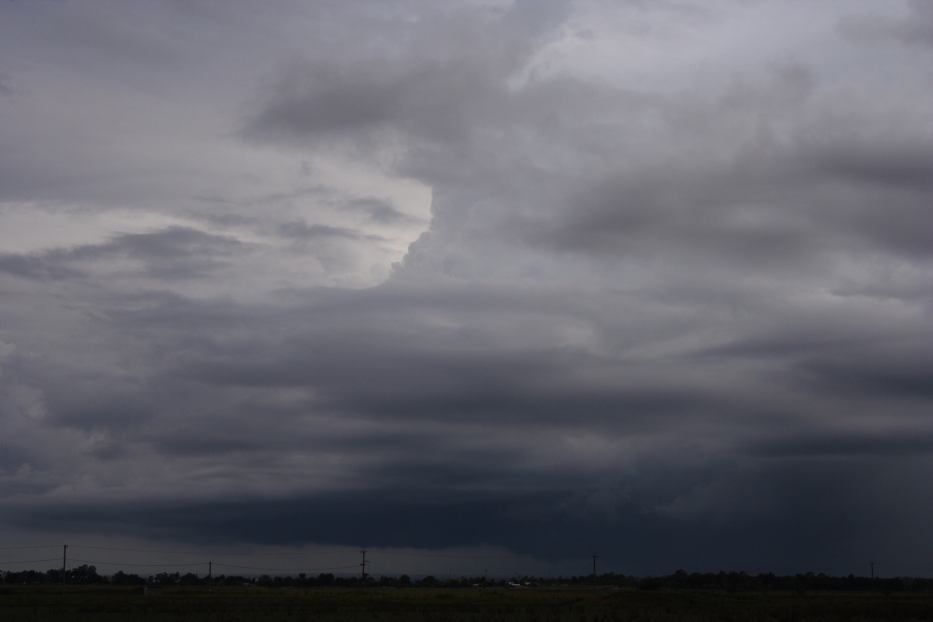
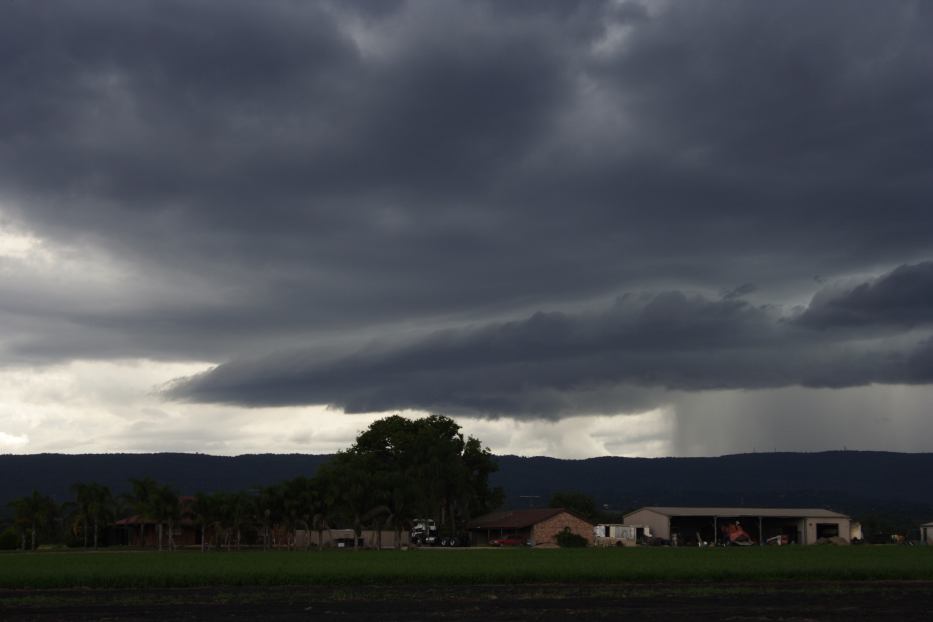
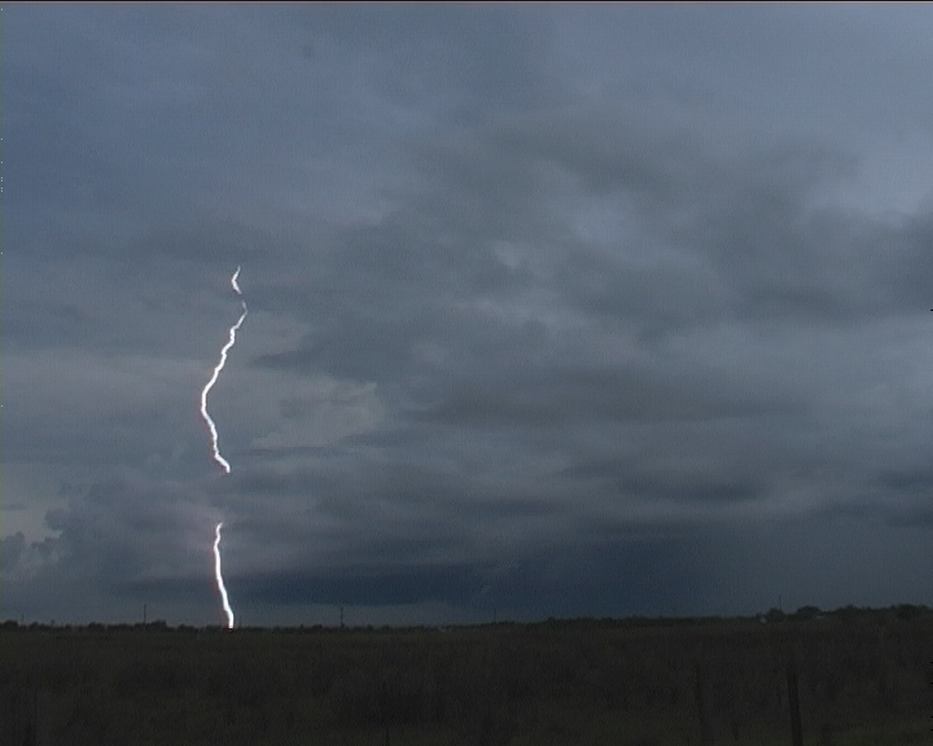
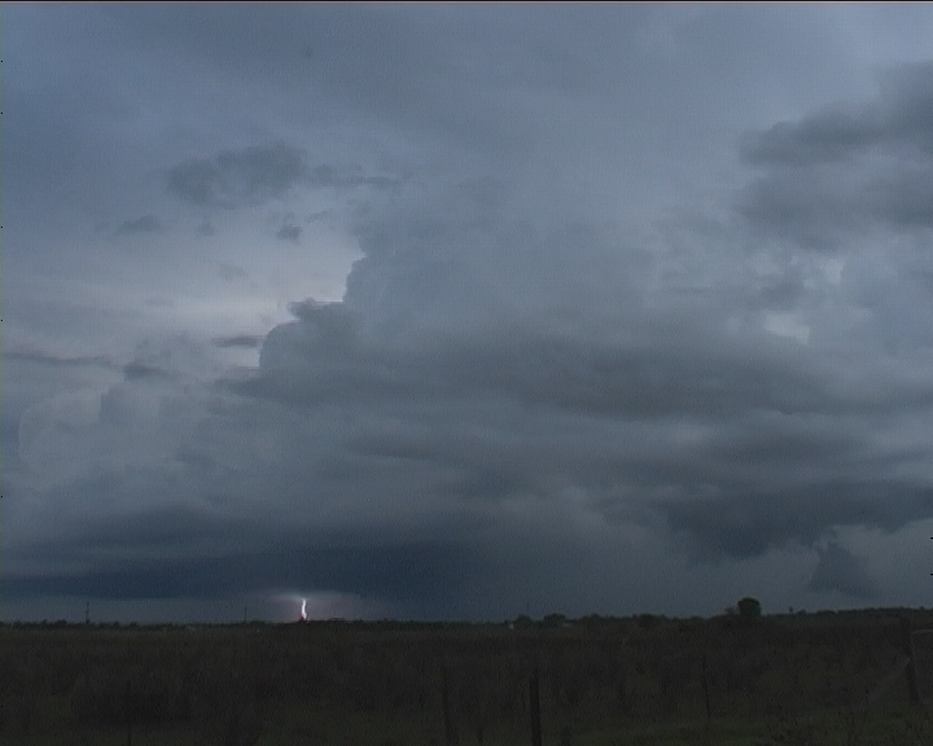
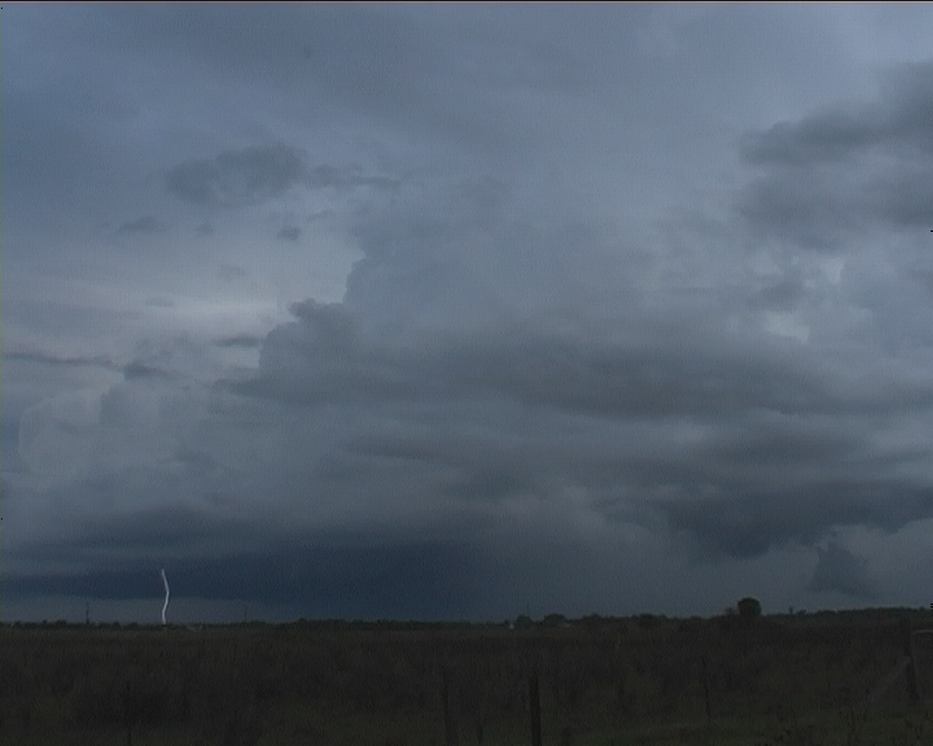
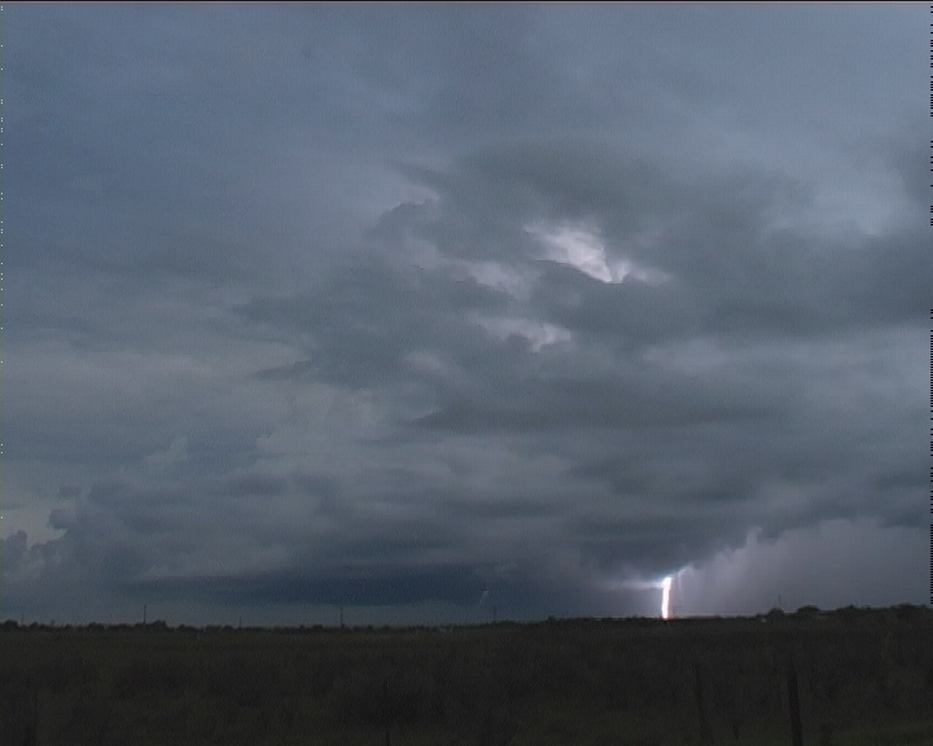
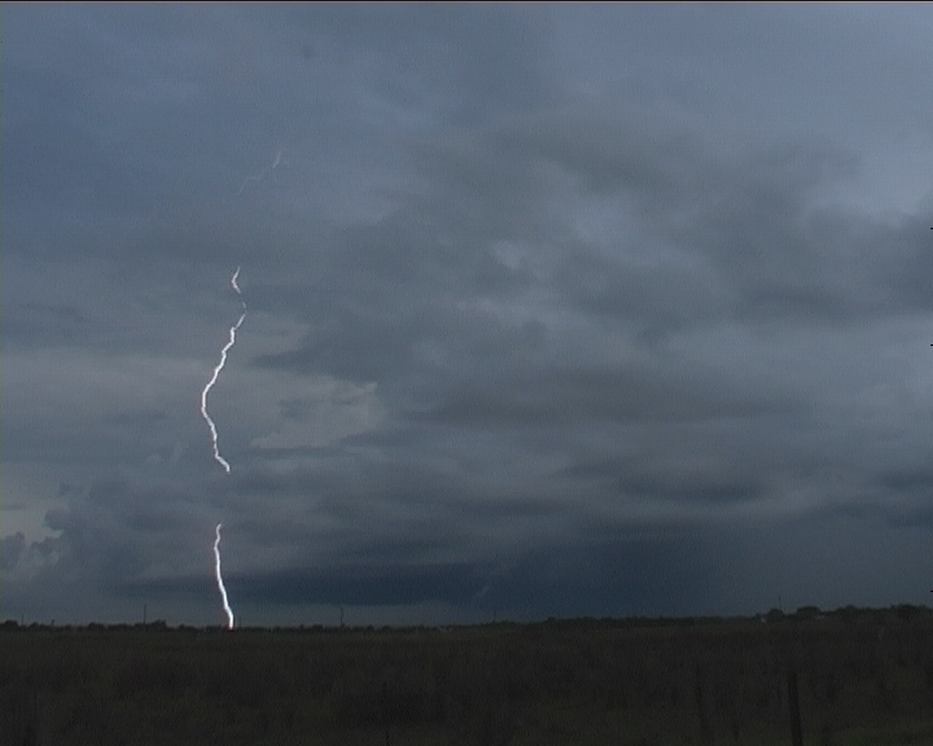
Whilst filming, a double major bolt descended through the cloud from the top of the updraft and most likely the anvil. The danger in these bolts is they seemed to come through the mid-level cloud. I set up the tripod and captured some impressive video of multiple bright bolts coming from this now impressive updraft and anvil through the mid level cloud as well. The updraft gradually became obscured by the mid-level cloud so I aimed for the southwestern activity.
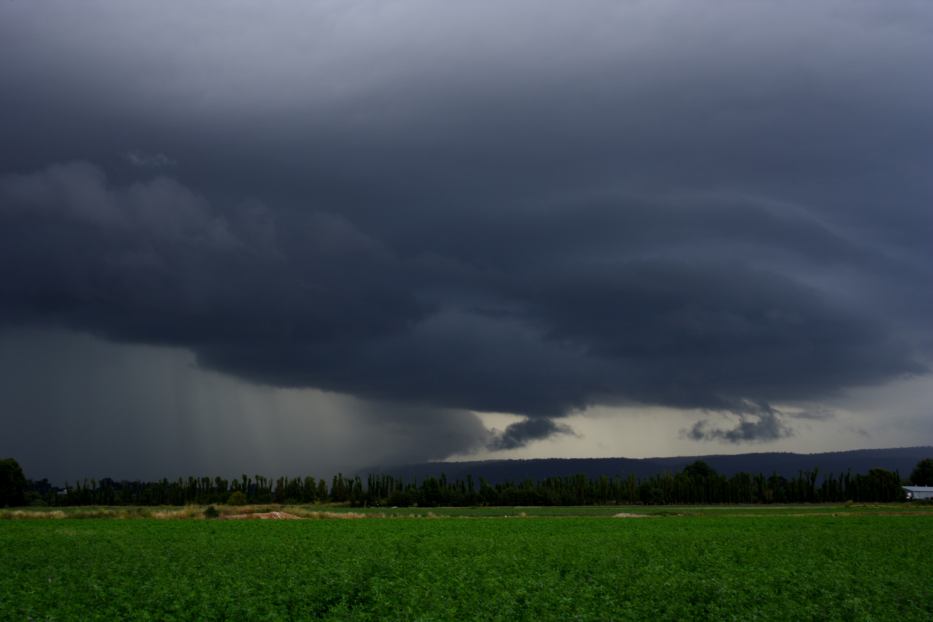
I knew we were in for flash flooding rain rates from this event based on the behaviour of the cells being slow moving. More lightning bolts to the south and I headed for those storms but they were sparse. Finally I set up for the region near Agnes Banks where heavy rain hugged the mountains. From here I headed home.
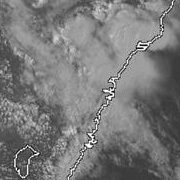
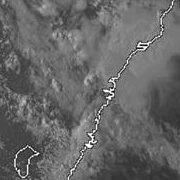
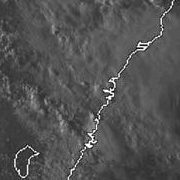
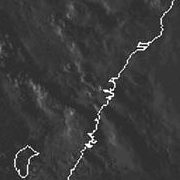
During the night we had heavy rain for about an hour which is definitely the heaviest rain we have had for about a year! Cell upon cell developed rapidly overhead. We were always situated near the convergence line with a few cells to the west of the convergence moving south early on and colliding with the line from the southwest. I suspected a surface low may have developed. The two maps below from the Bureau of Meteorology show most of rainfall fell during the night period.
My official reading this morning for the previous 24 hours is 91.6mm which is in agreement with the 90mm I think which was from the Box Hill rainfall pluviometer.
Some more video stills - unfortunately the lightning bolts had come out too far out of frame to capture - now that suggests just how dangerous lightning can be.
From
Weatherzone
 4pm to 7pm local
From
Bureau of Meteorology
 Sydney sounding at 3pm 26/02 local
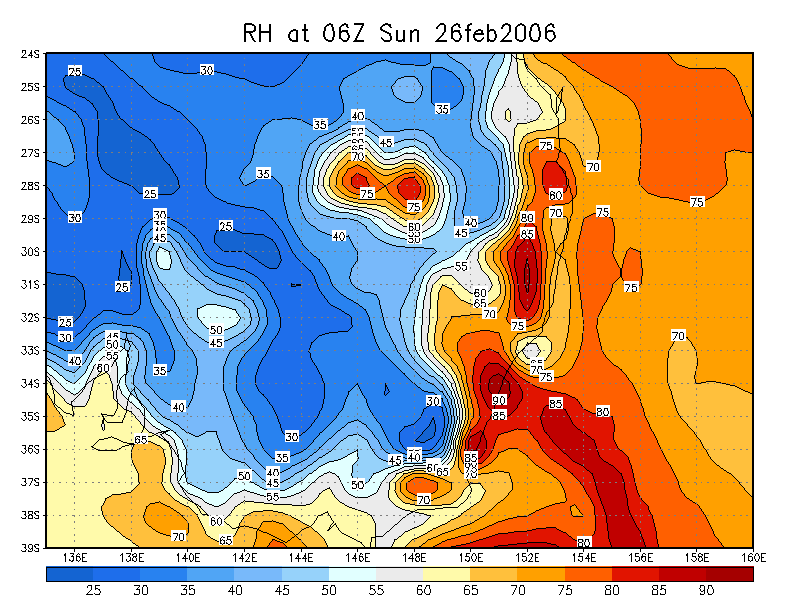
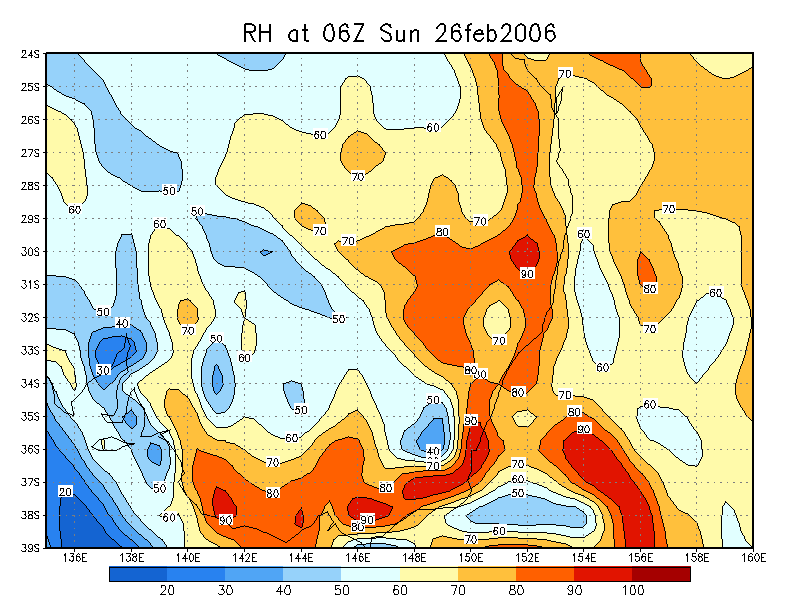
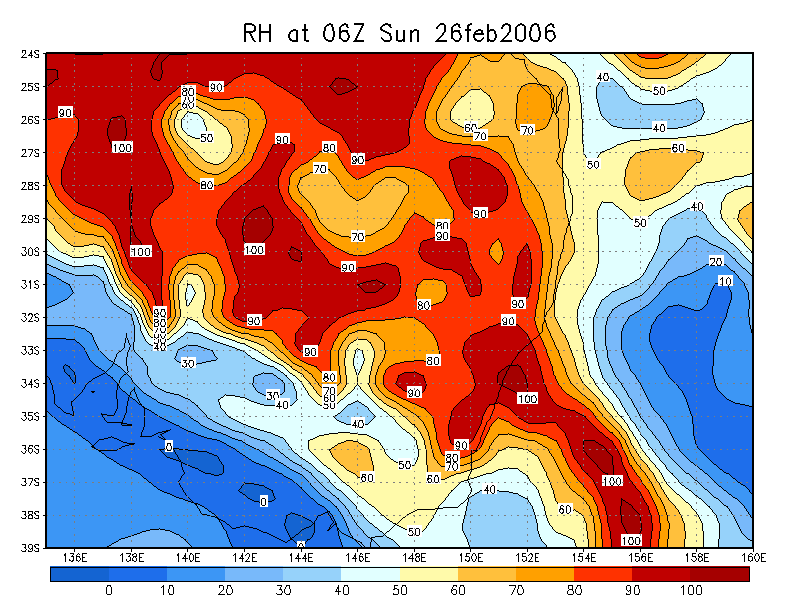
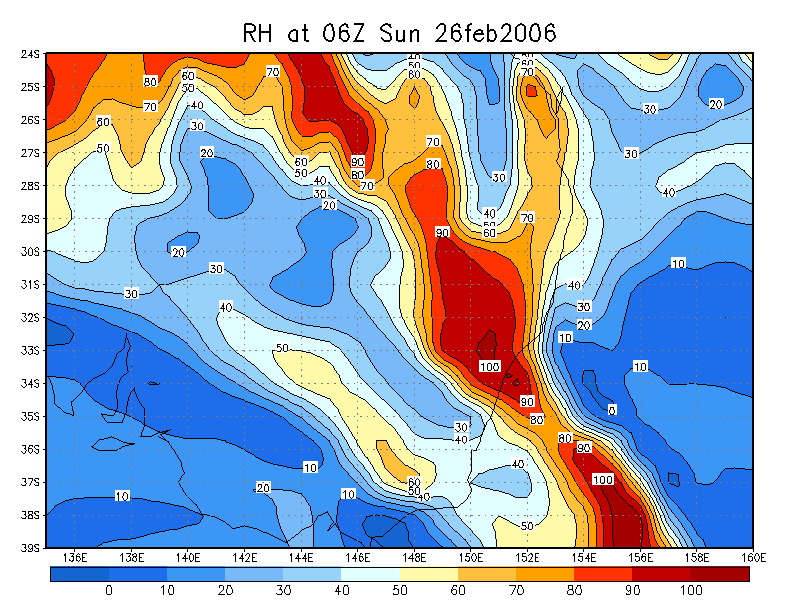
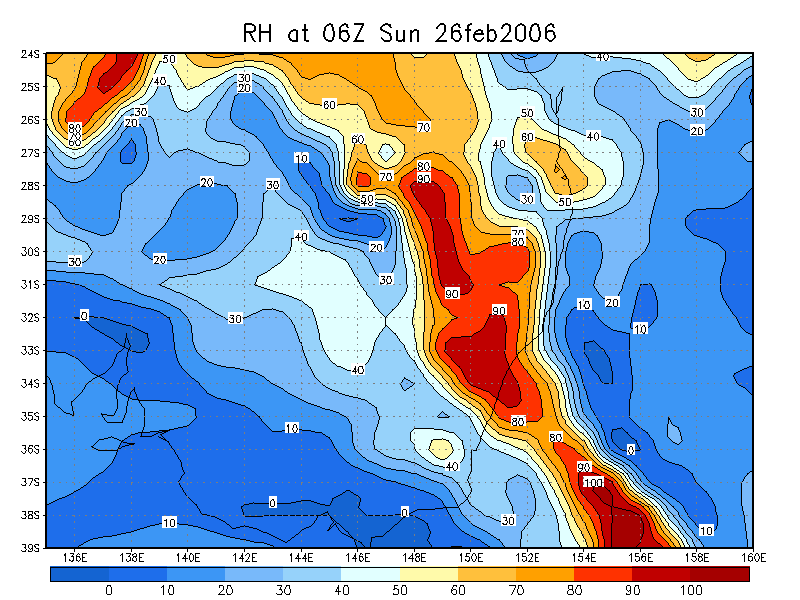
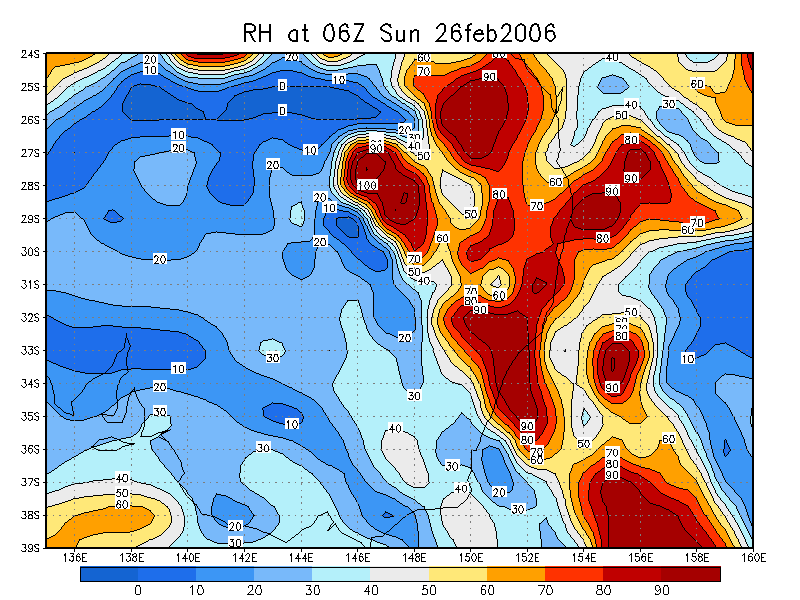
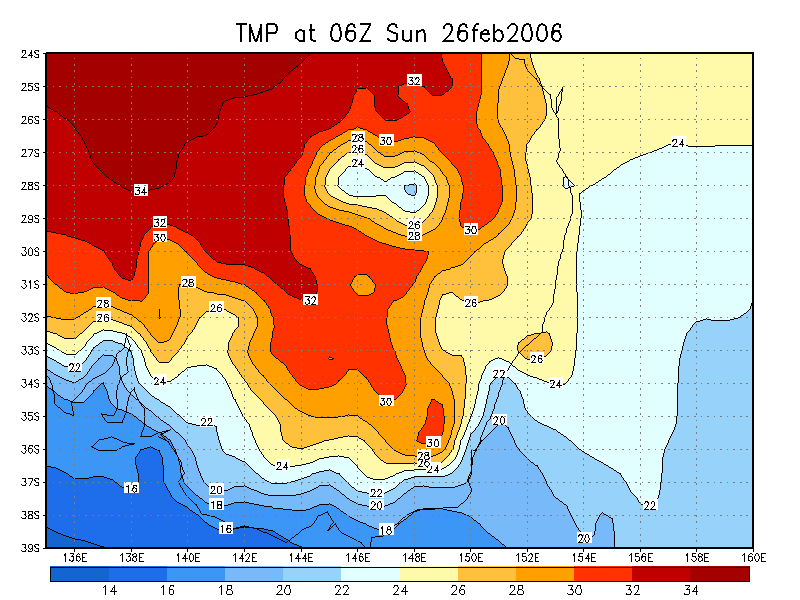
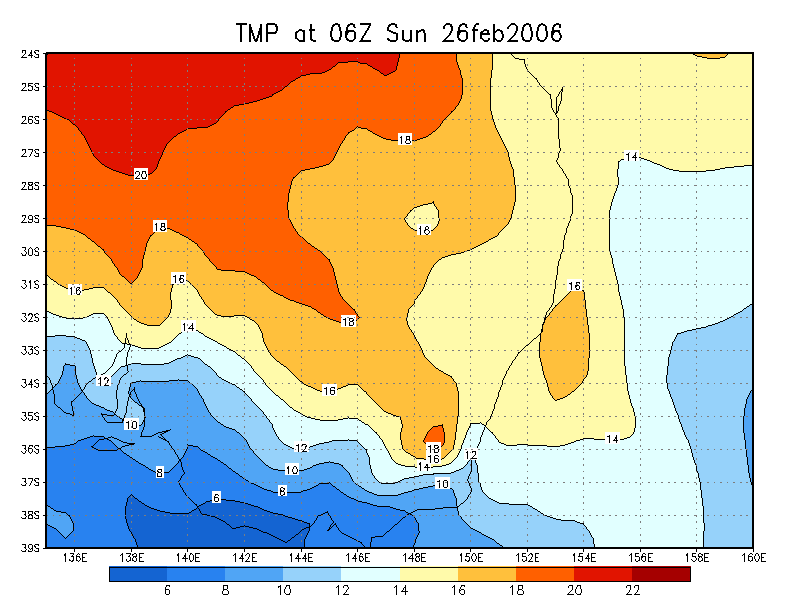
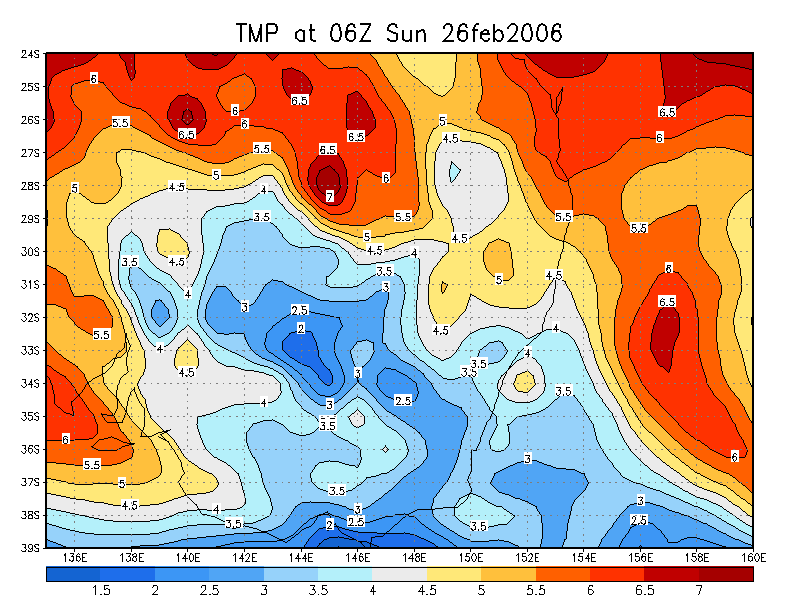
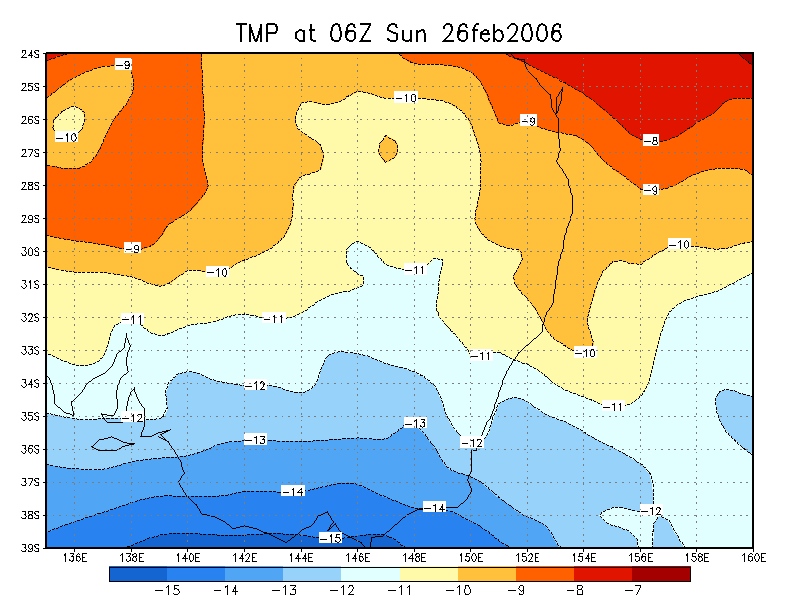
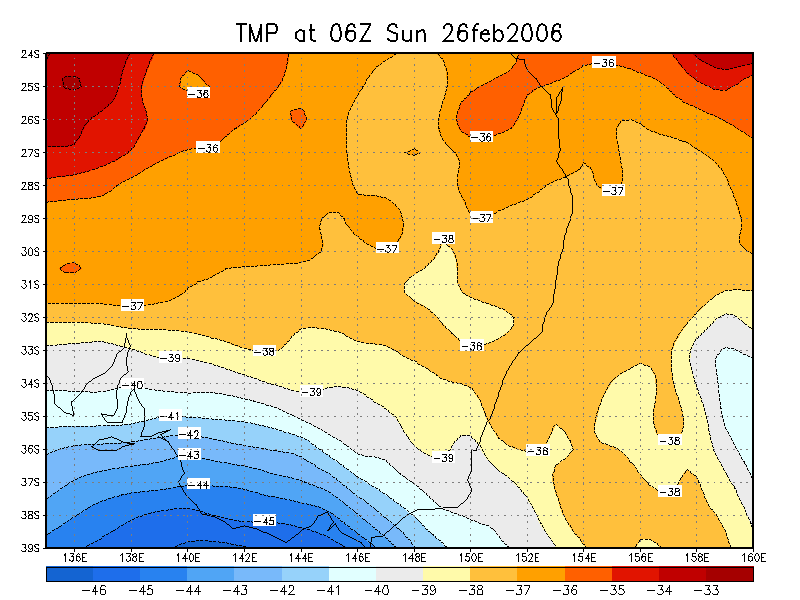
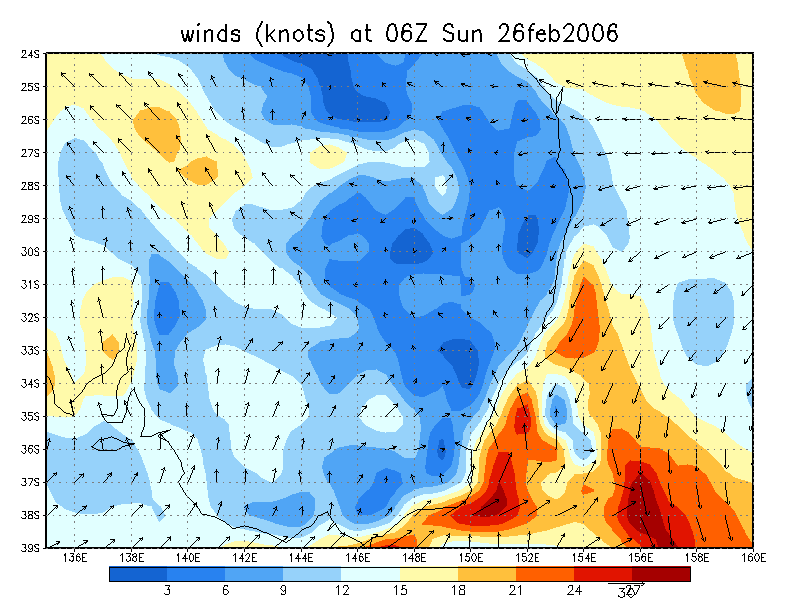
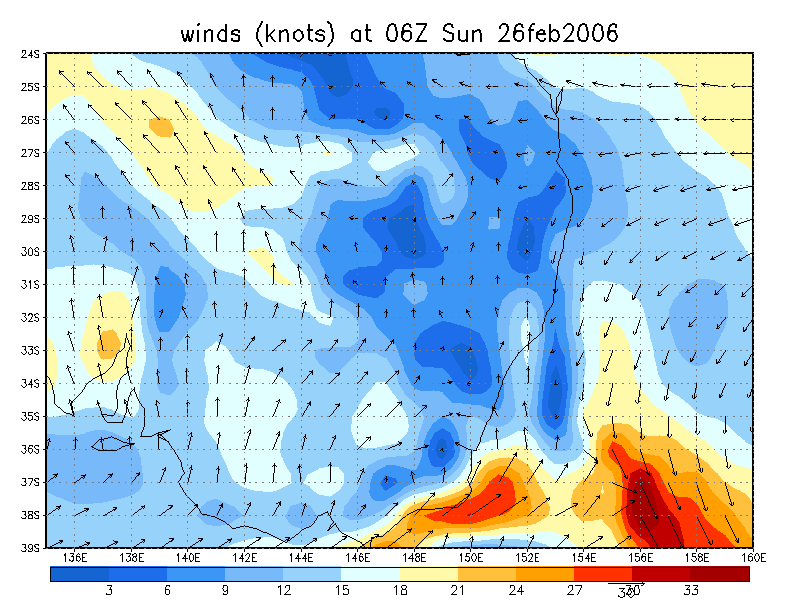
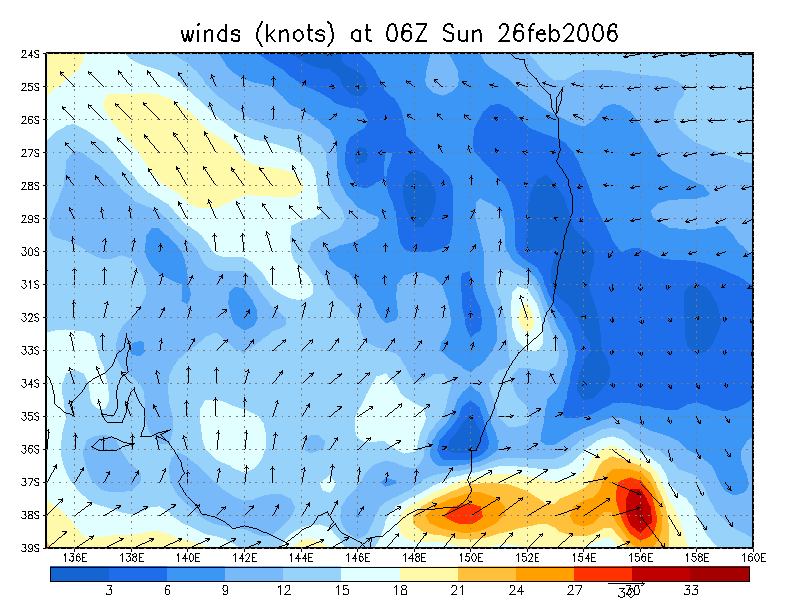
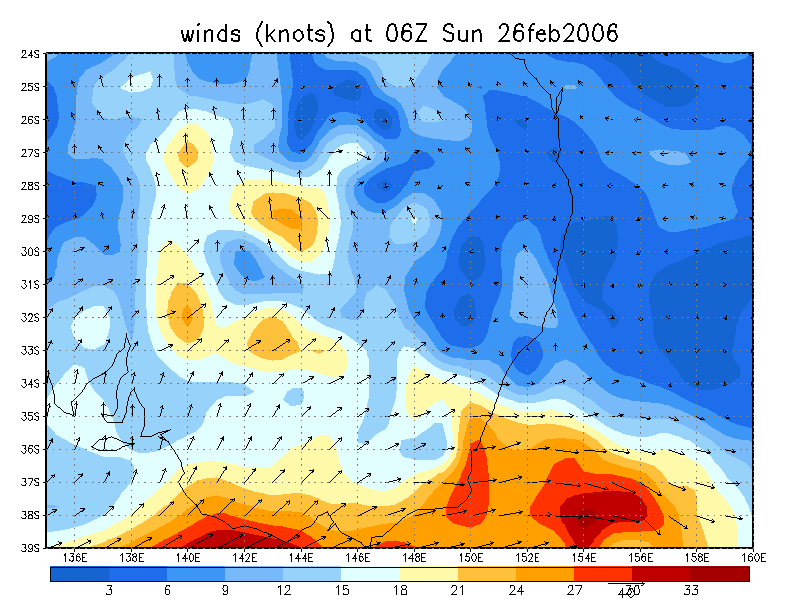
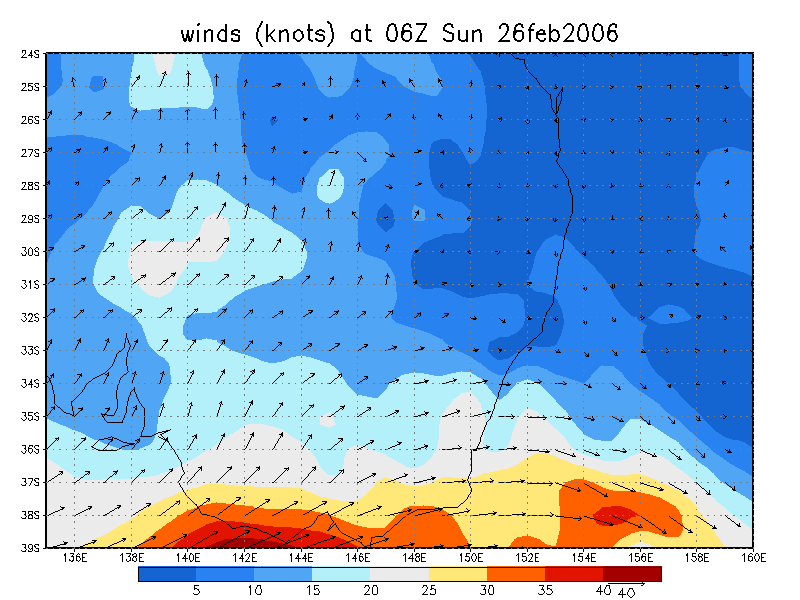
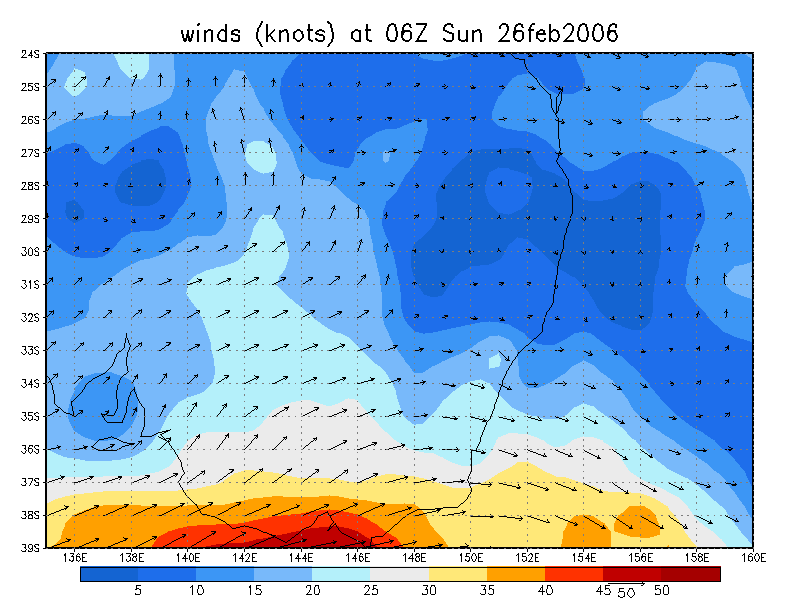
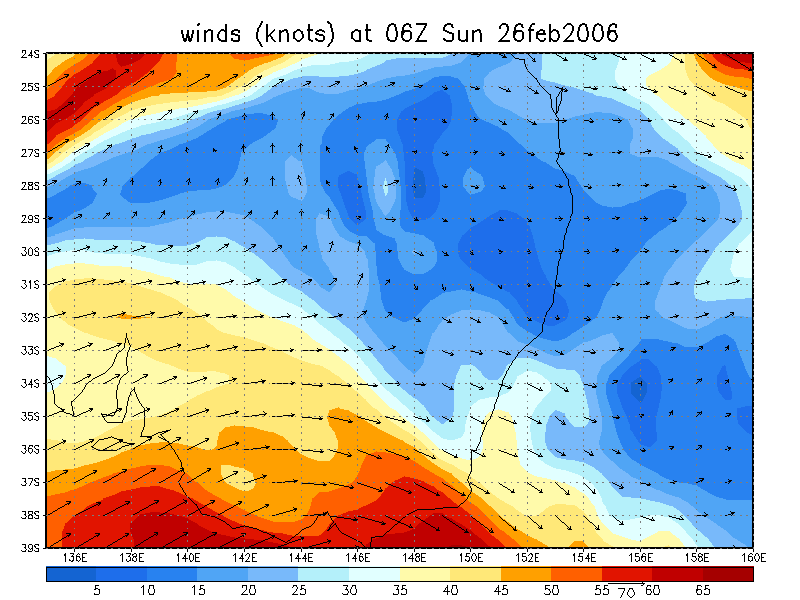
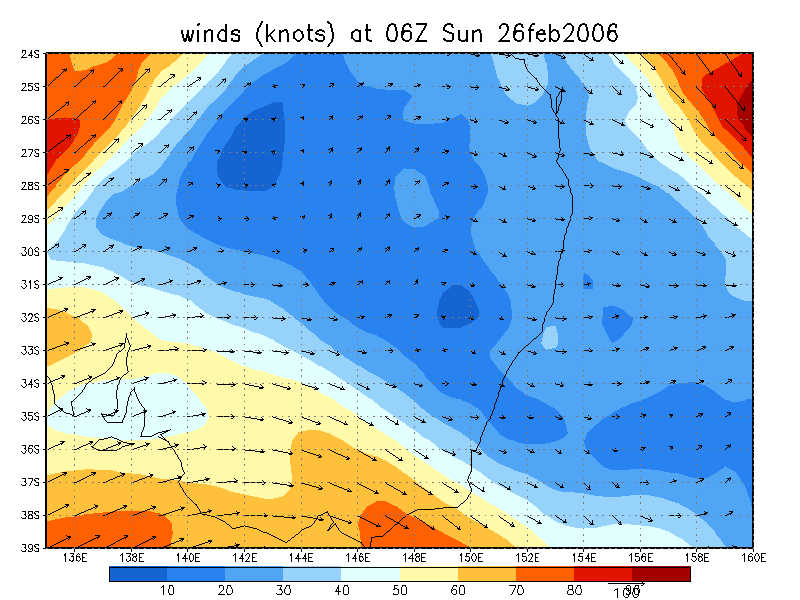
From NOAA 26/02/2006 06z analysis
|
Document: 200602-05.htm Updated: 28th February 2006 |
[Australian Severe Weather index] [Copyright Notice] [Email Contacts] [Search This Site] |