and Chasing
[Index][Archives]
Sculptured Low Precipitation Supercell NSW North Coast: Monday 20th October 2003
Report compiled by Michael Bath and Dave Ellem
| Storm News and Chasing [Index][Archives] |
Sculptured Low Precipitation Supercell NSW North Coast: Monday 20th October 2003 Report compiled by Michael Bath and Dave Ellem |
Images appearing on this page must not be reproduced without permission.
A cloud band had moved through the Northern Rivers district during the morning with some heavy rainfalls totalling up to 35mm in 2 hours or so. It took until about noon before the last part of the cloud cleared to the east. Severe storms developed over the border in Southeast Queensland about 200km to the NW.
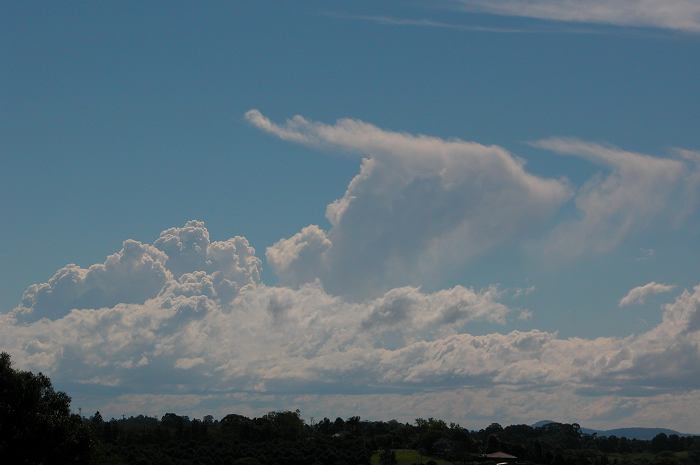
The Northern Rivers remained largely clear of any cloud apart from some medium sized cumulus persisting westward of the coast. Winds which had been northerly tended to the NW and the sky took on a rather dry appearance but the DP remained in the mid teens. Cumulus persisted and the winds eventually tended to the NE by about 4.15pm. Turkey towers developed NE of Grafton, and it wasn't long before an isolated dominant cell really took off.
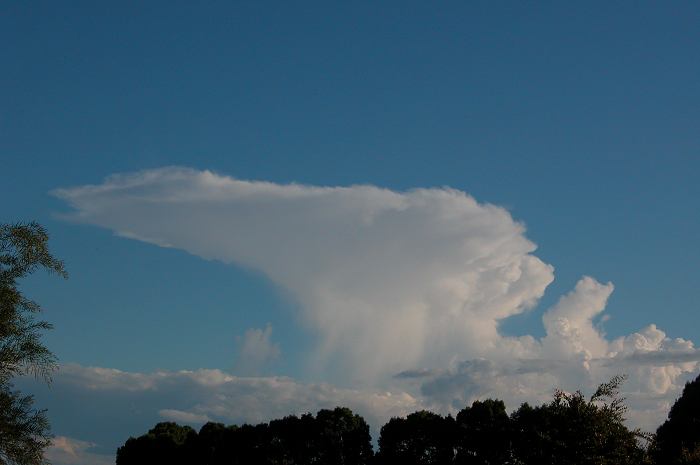
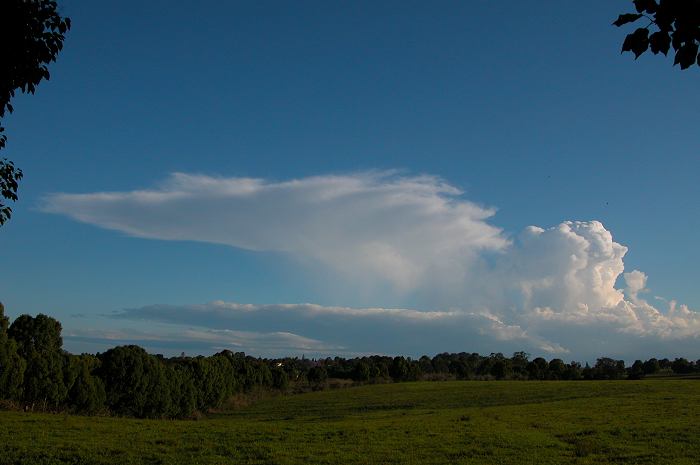
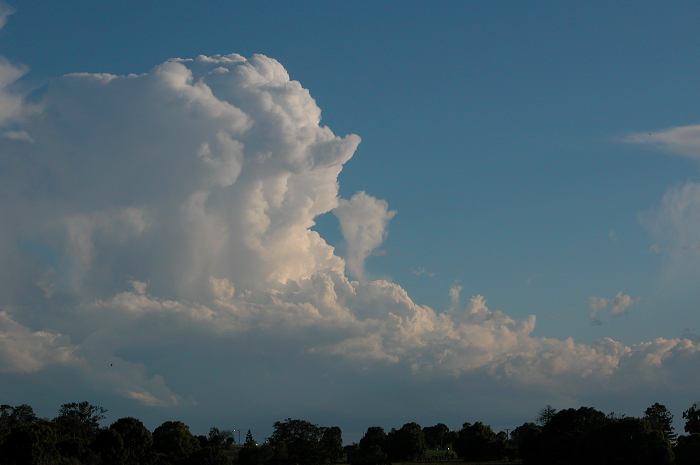
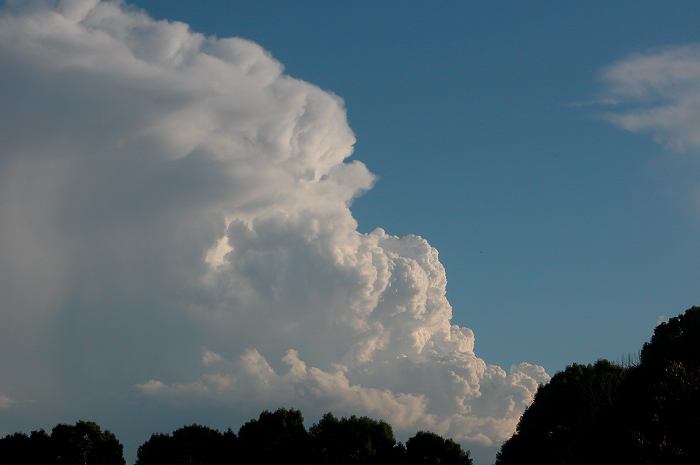
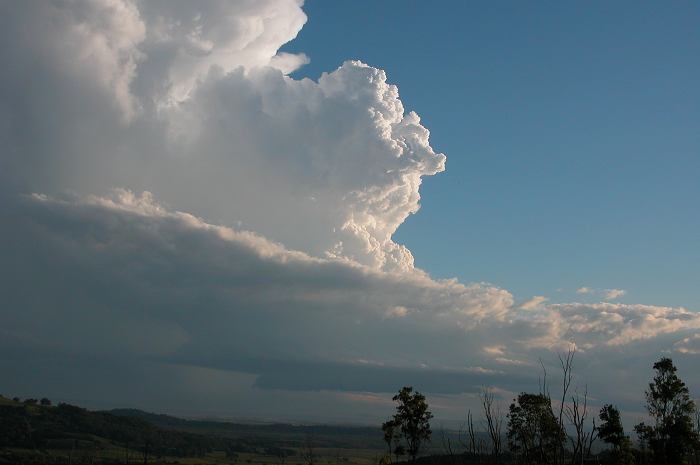
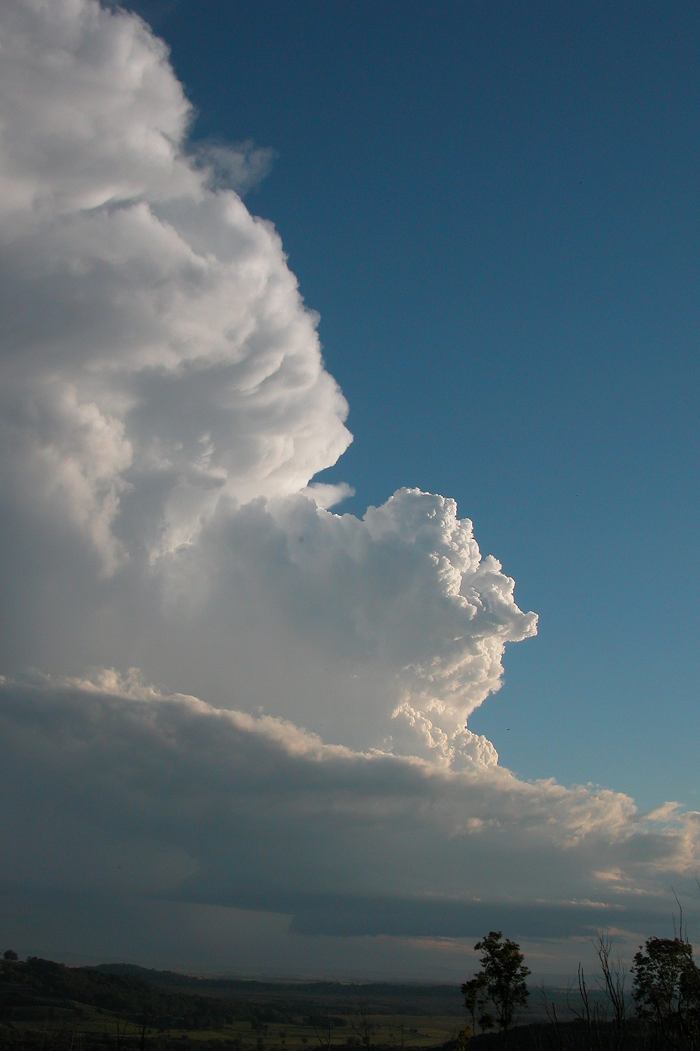
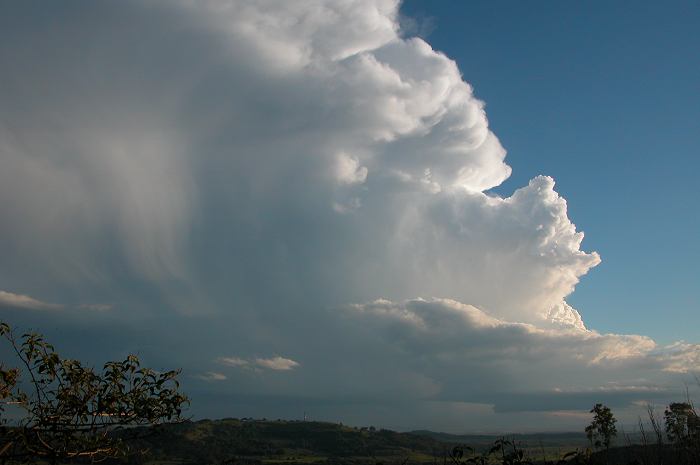
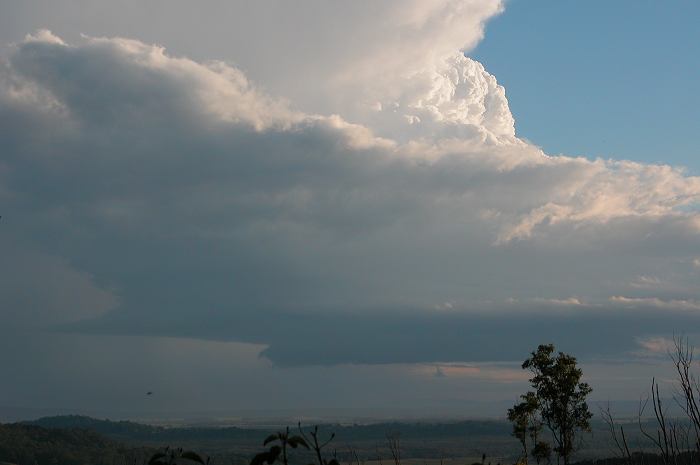
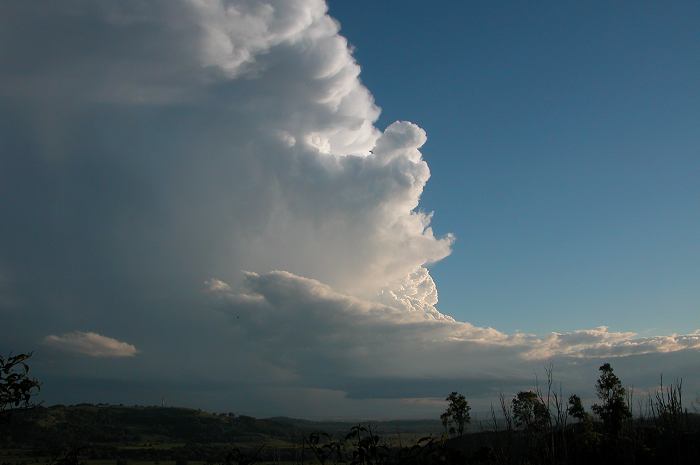
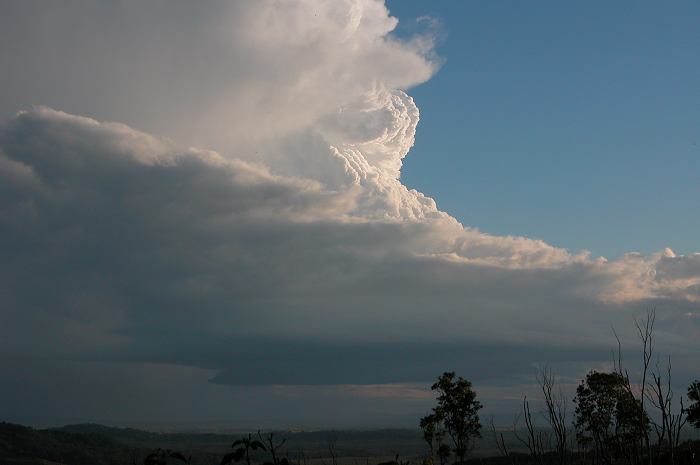
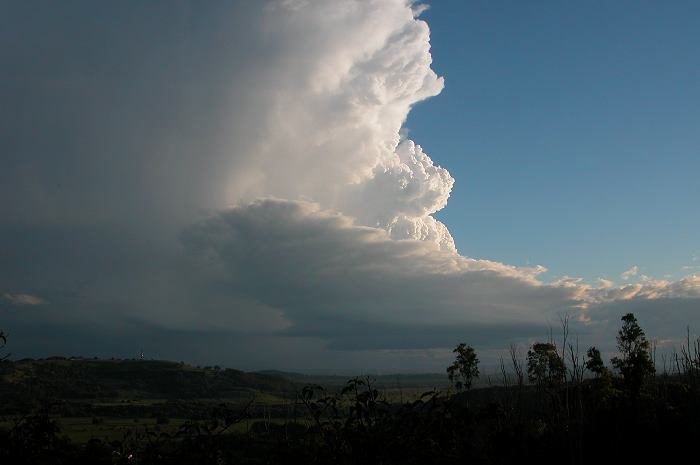
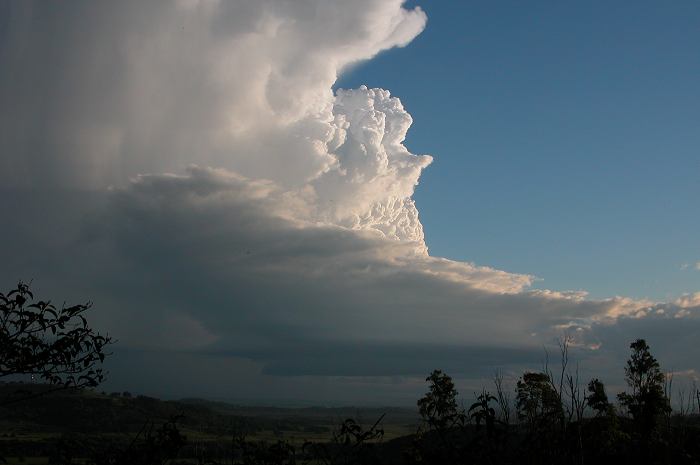
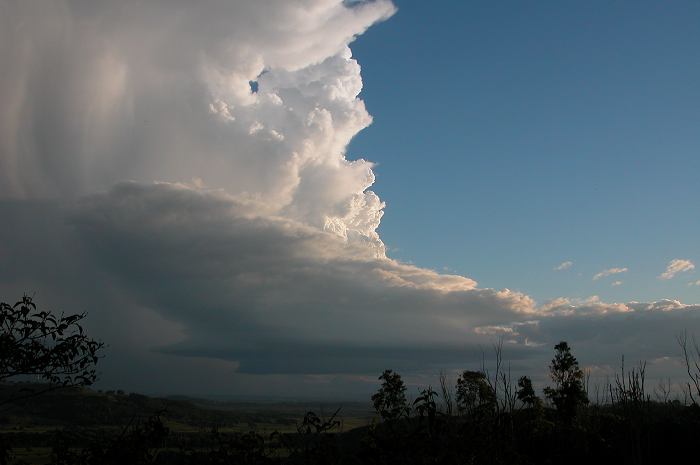
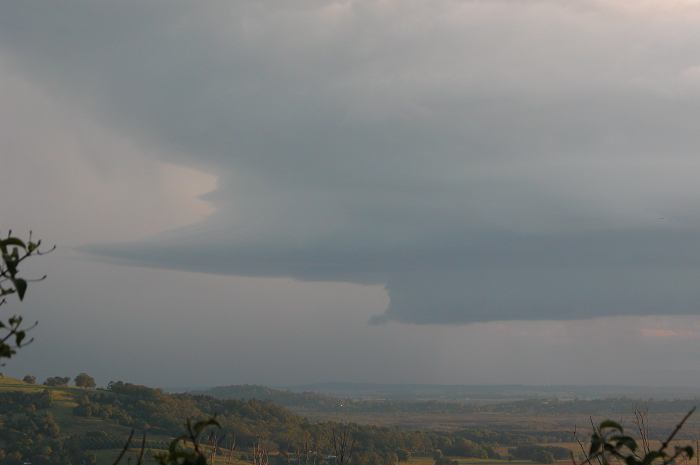
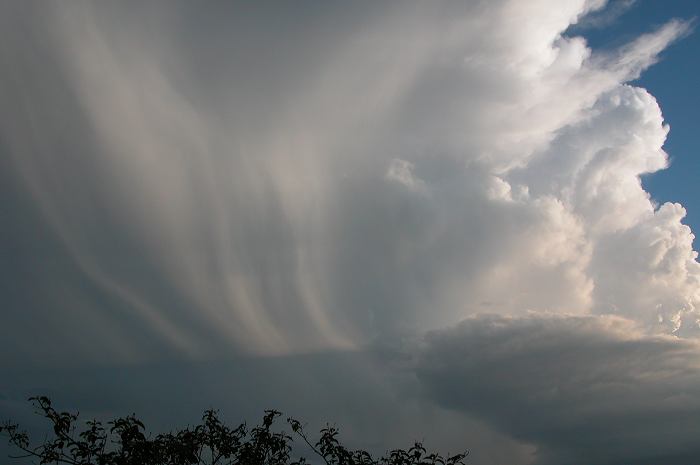
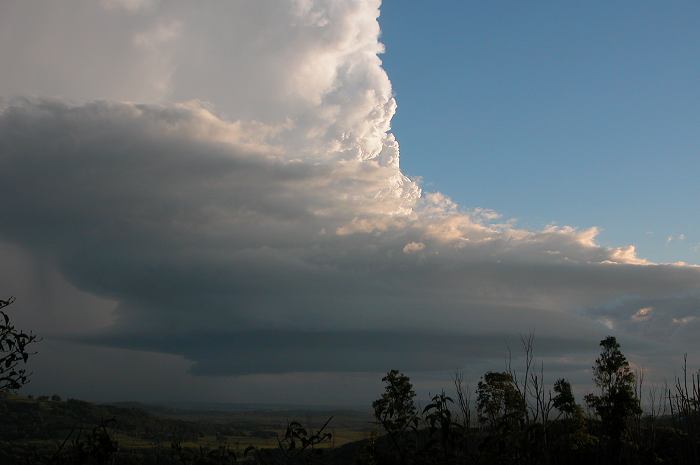
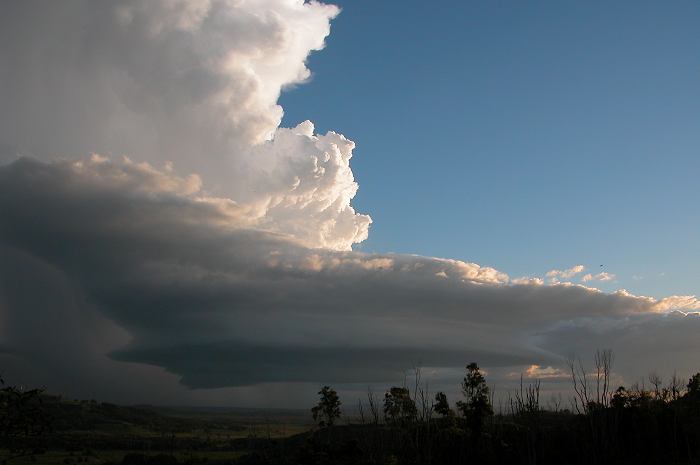
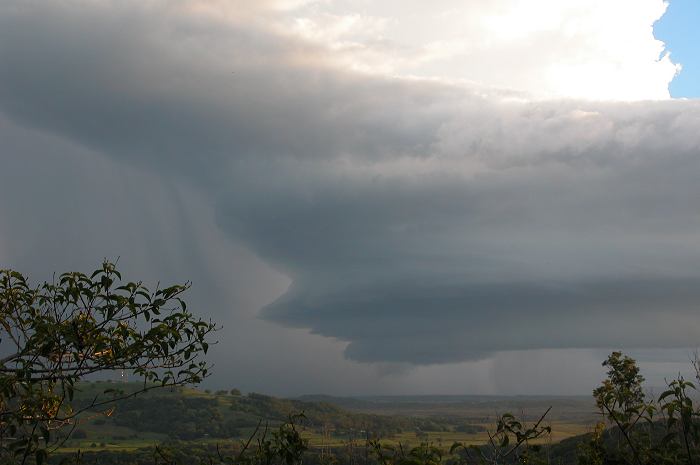
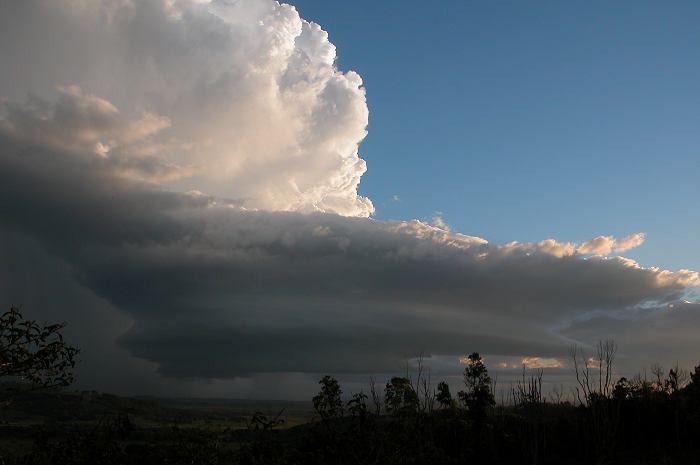
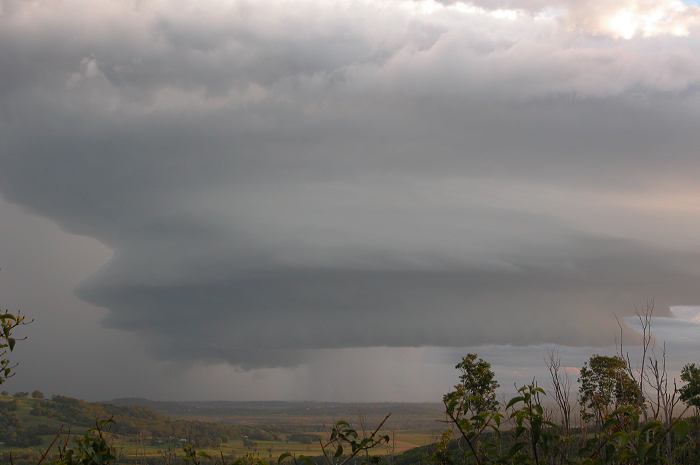
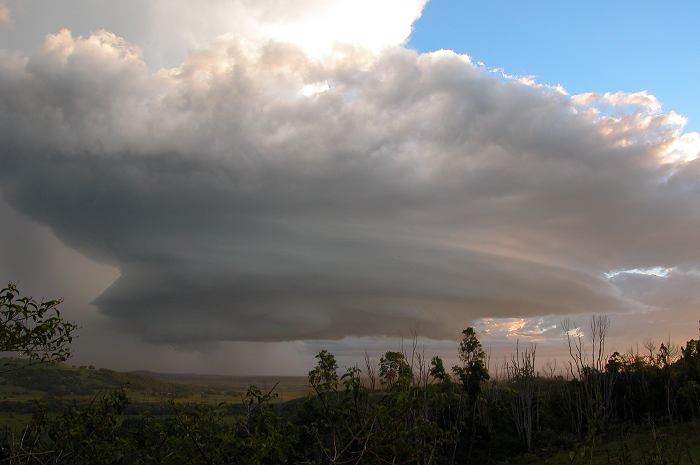
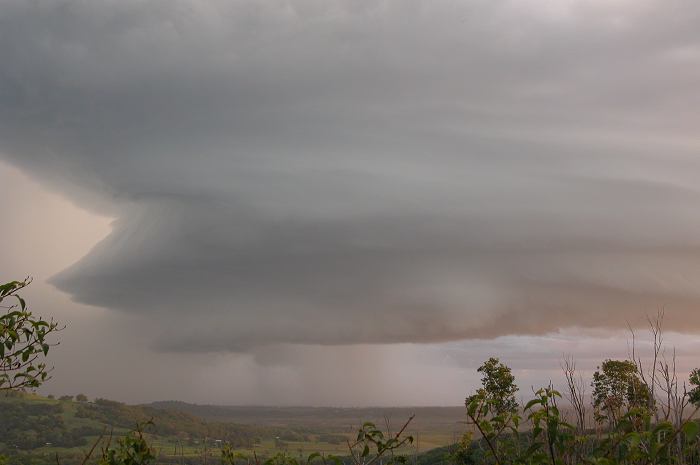
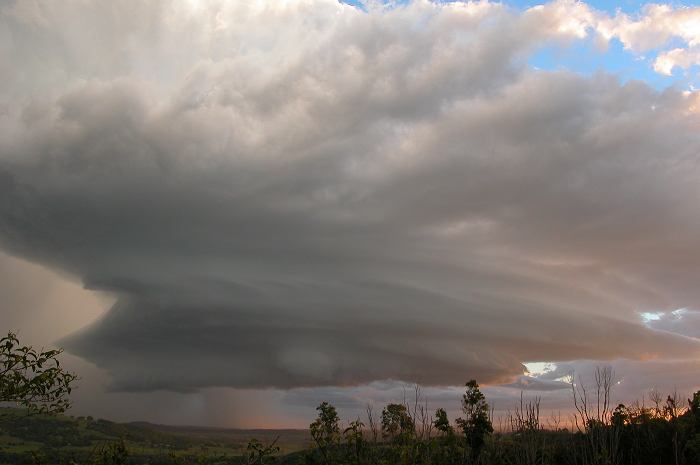
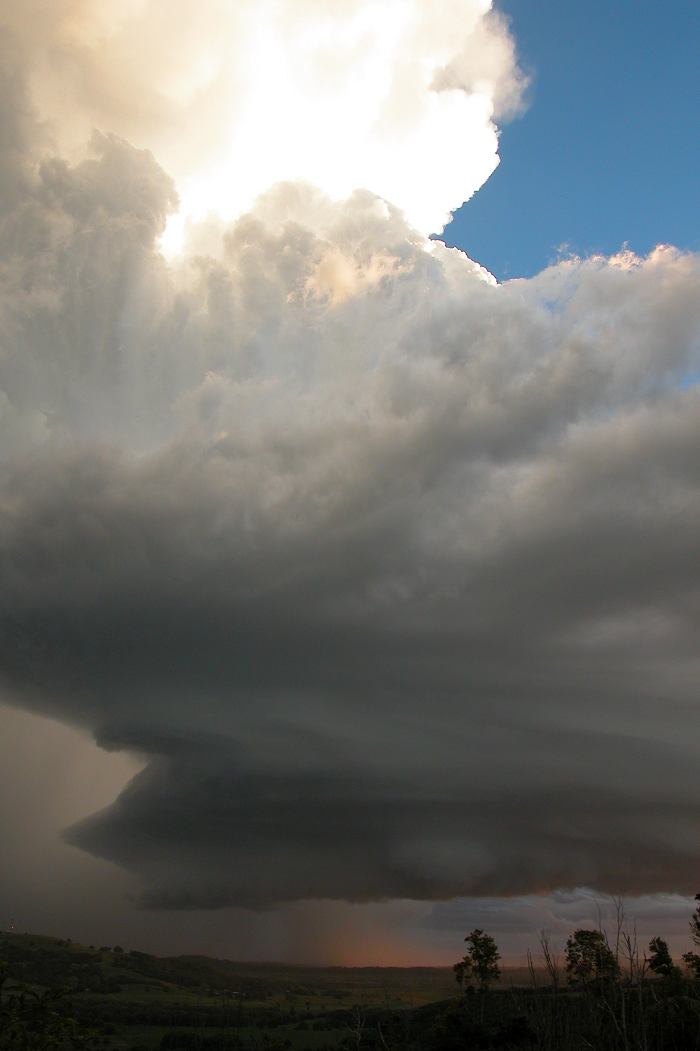
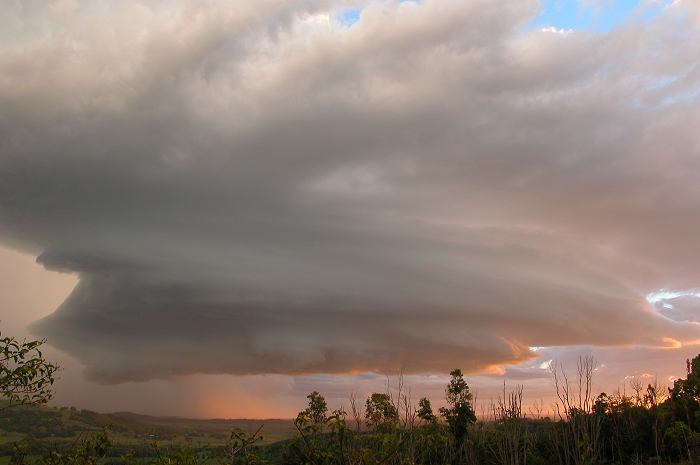
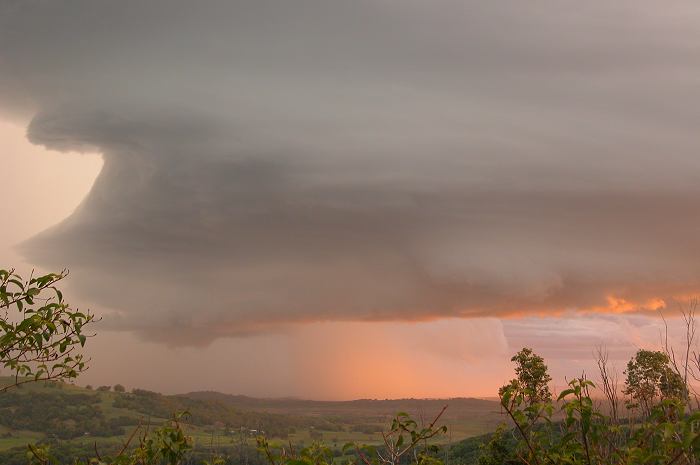
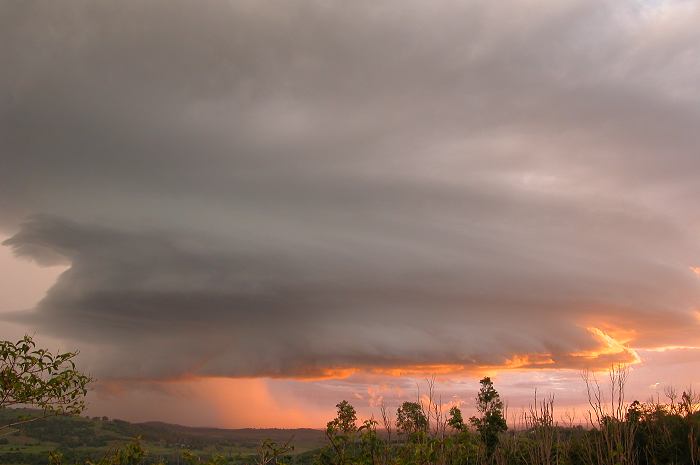
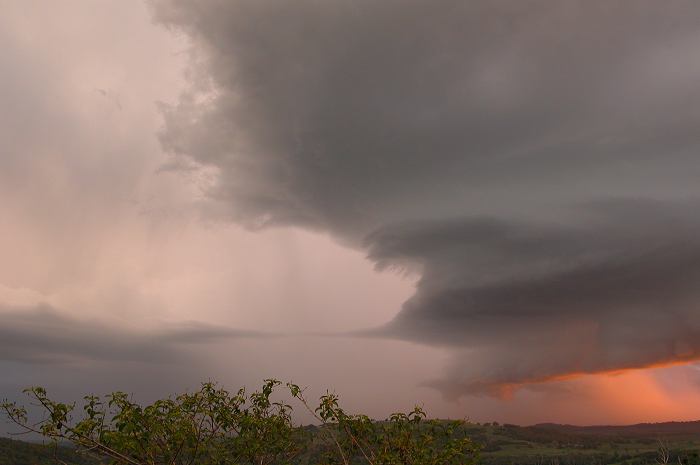
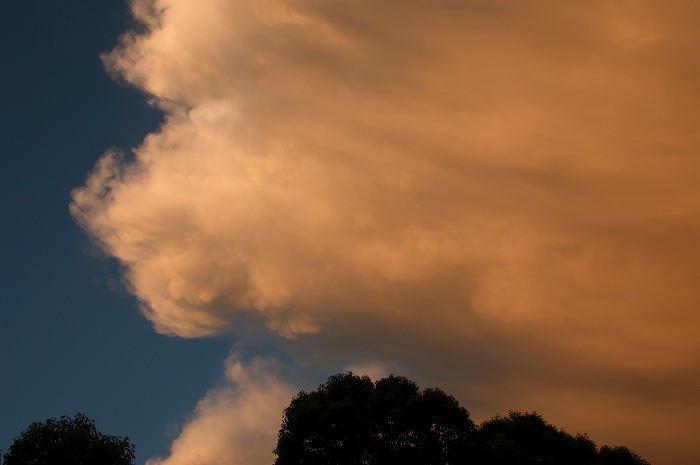
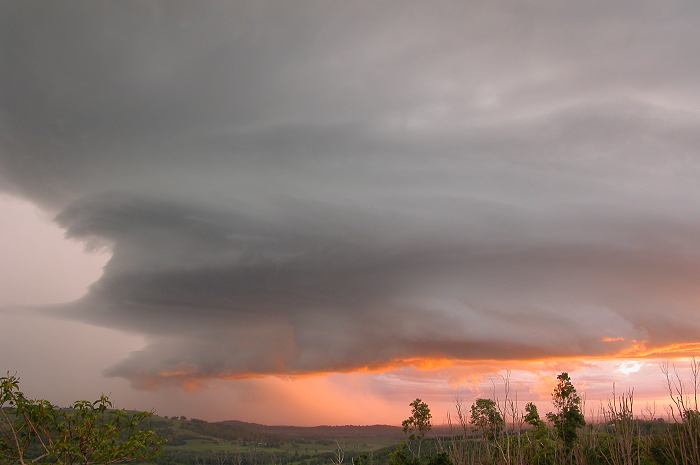
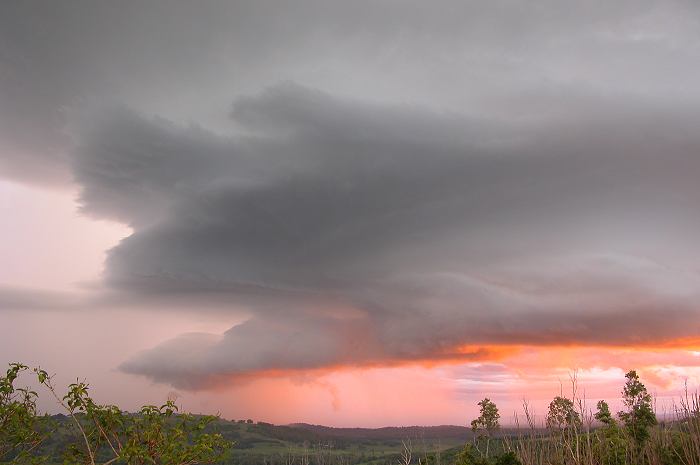
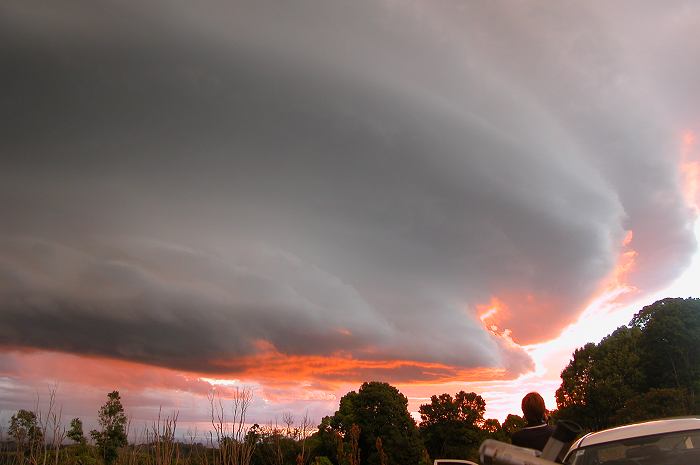
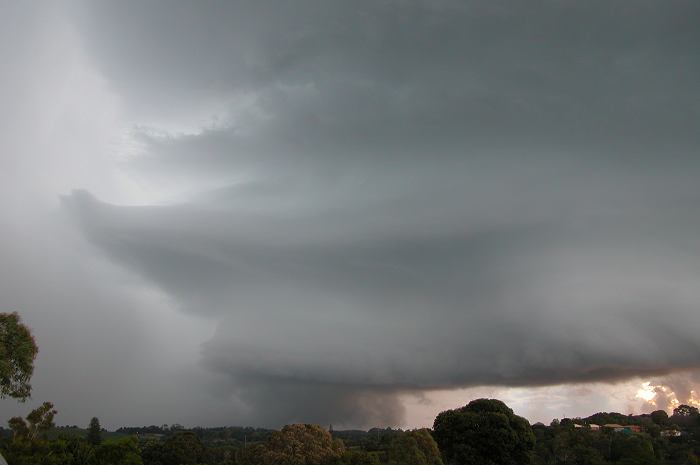
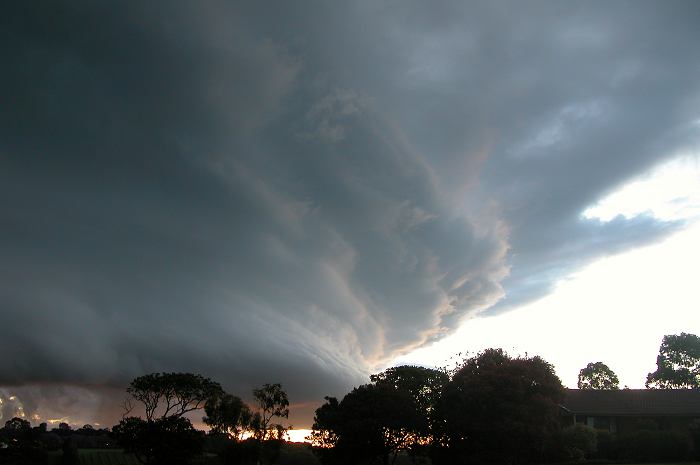
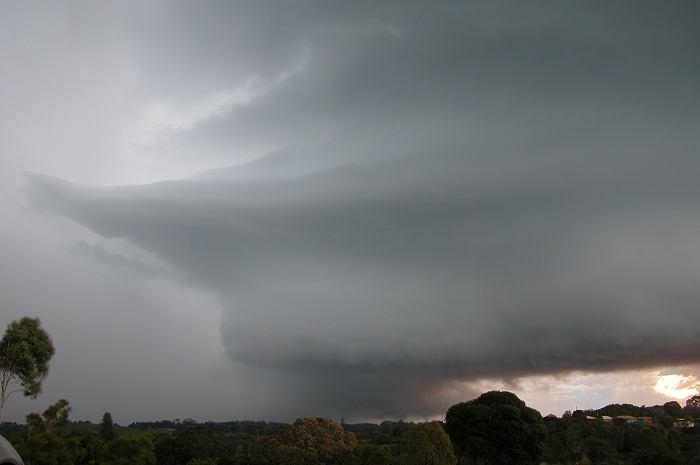
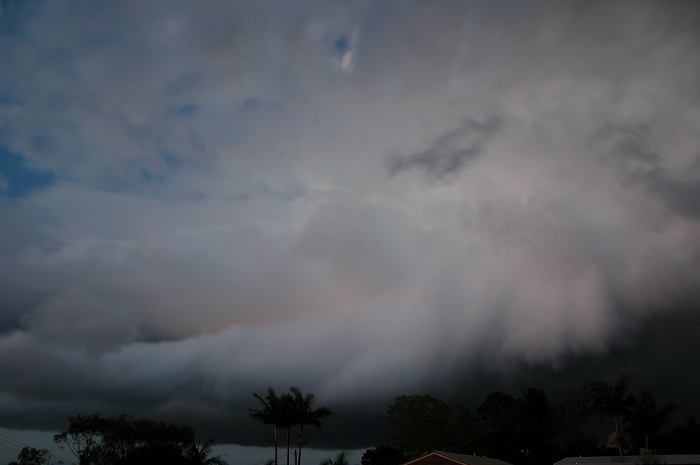
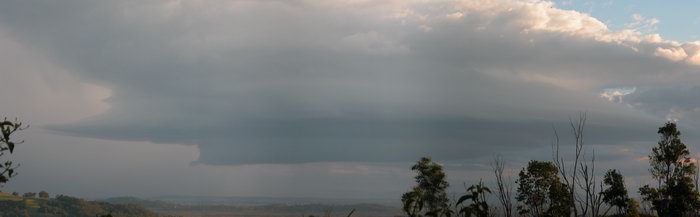
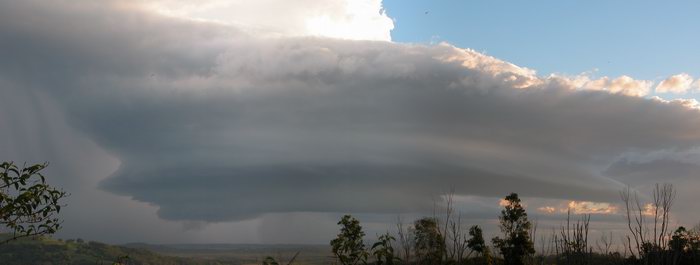
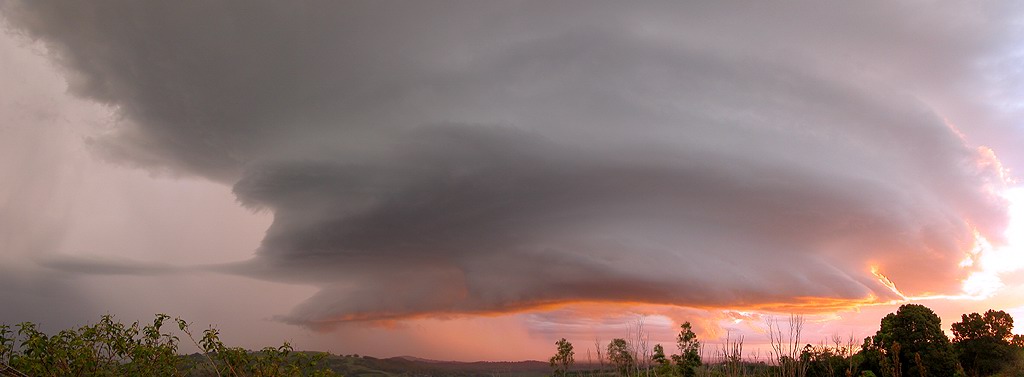
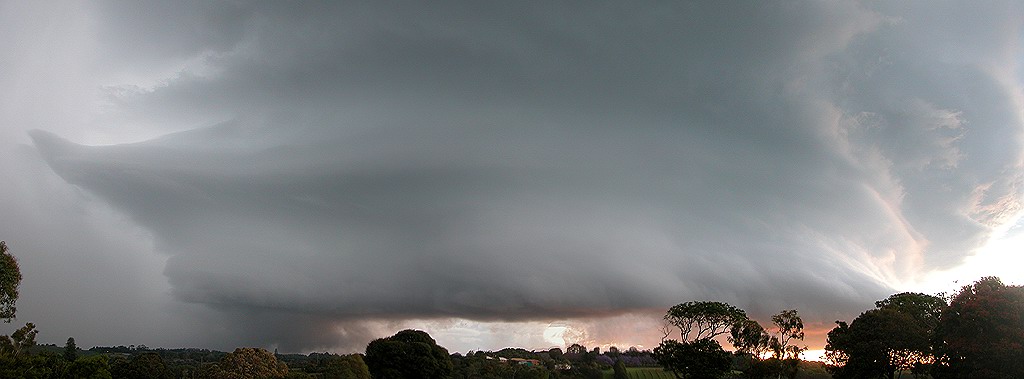
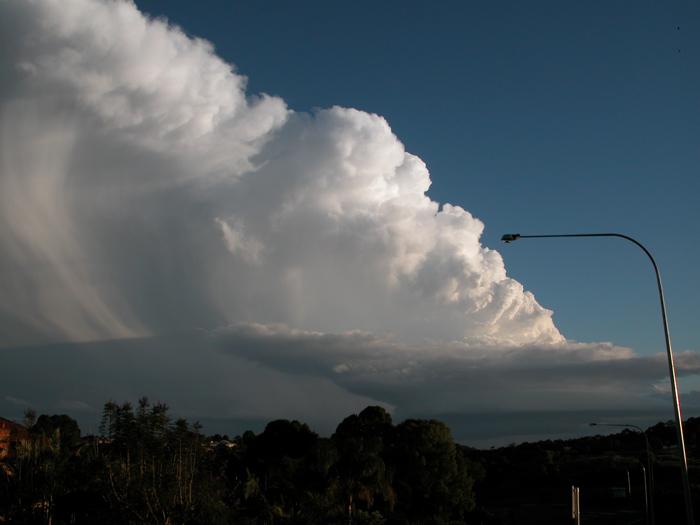
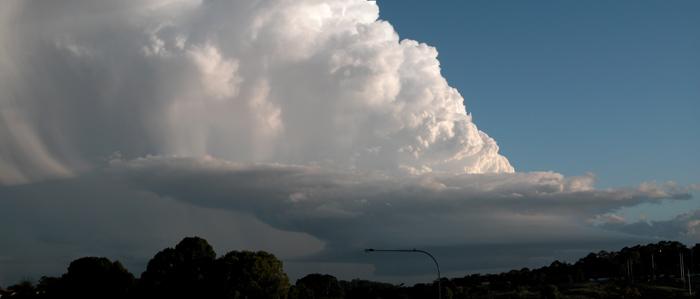
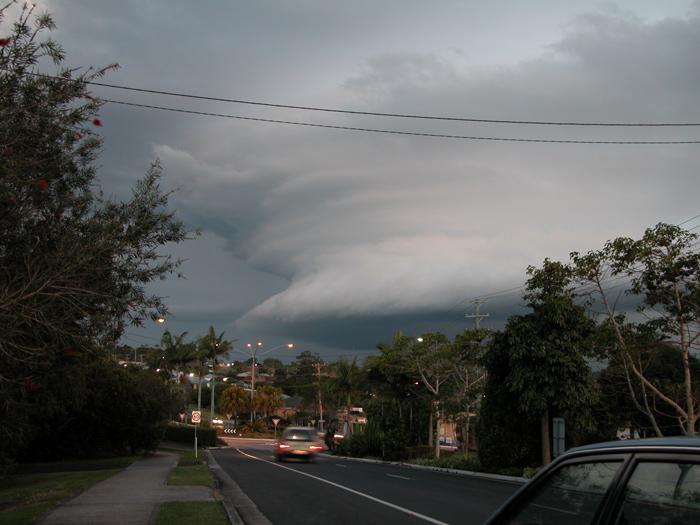
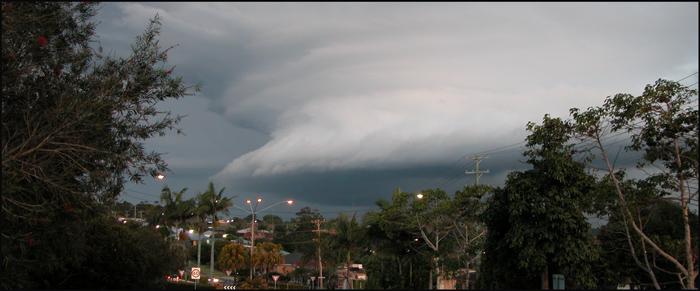
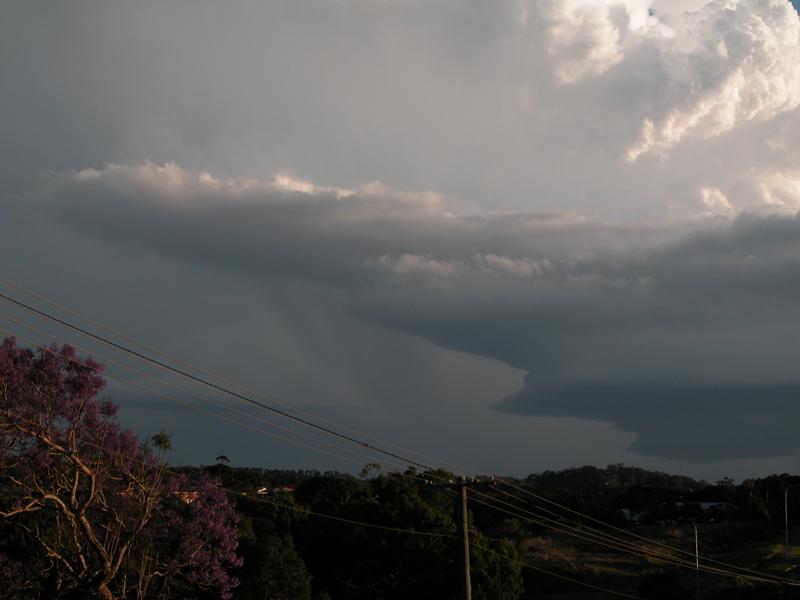
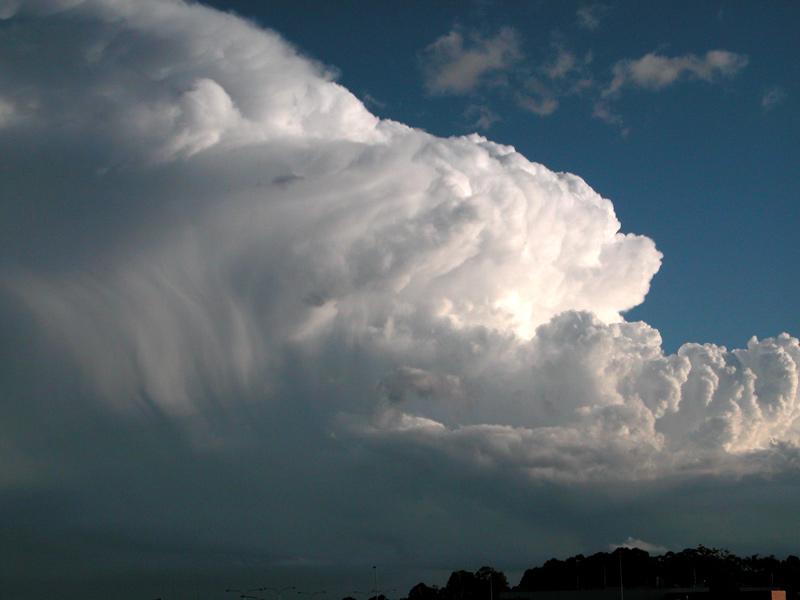
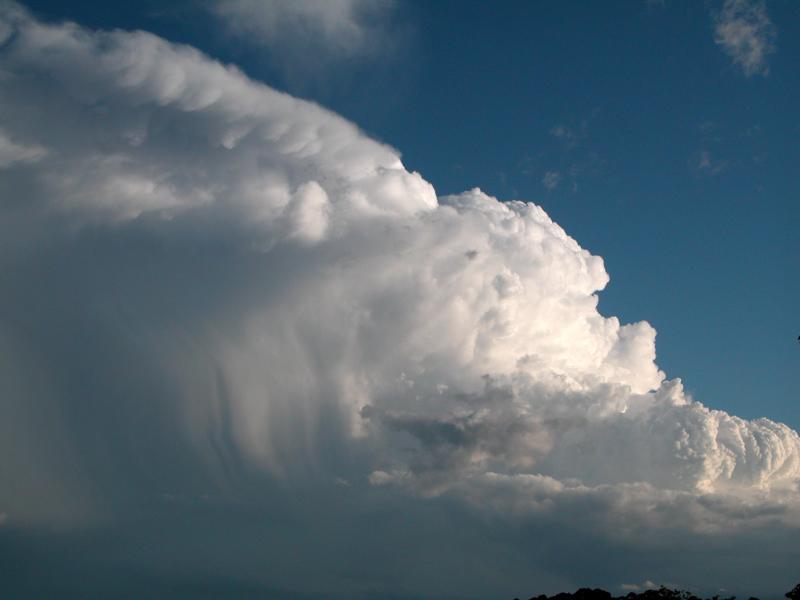
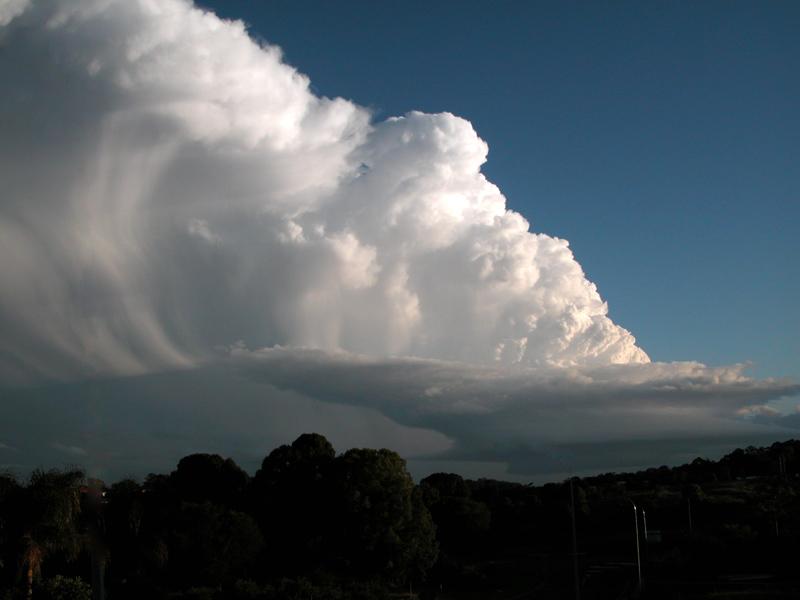
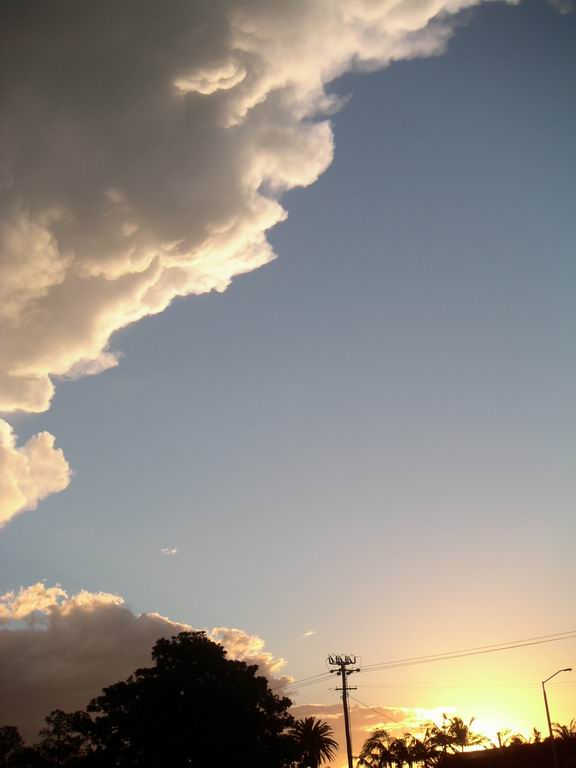
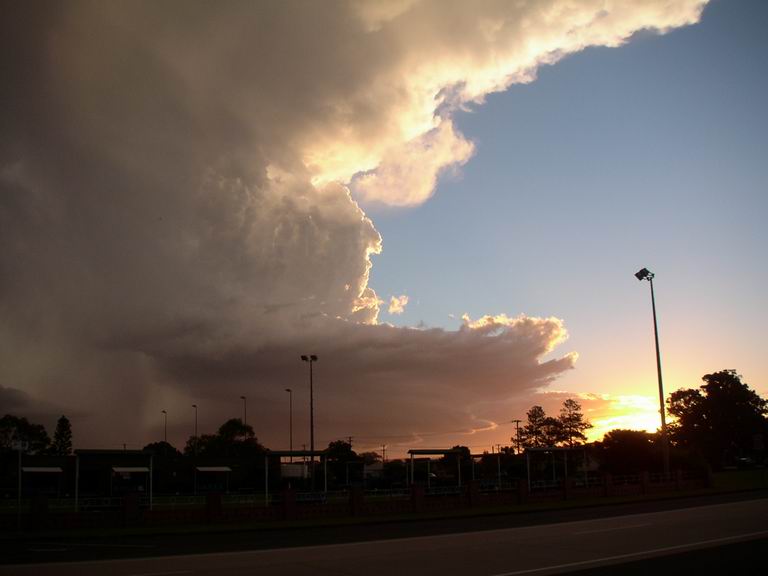
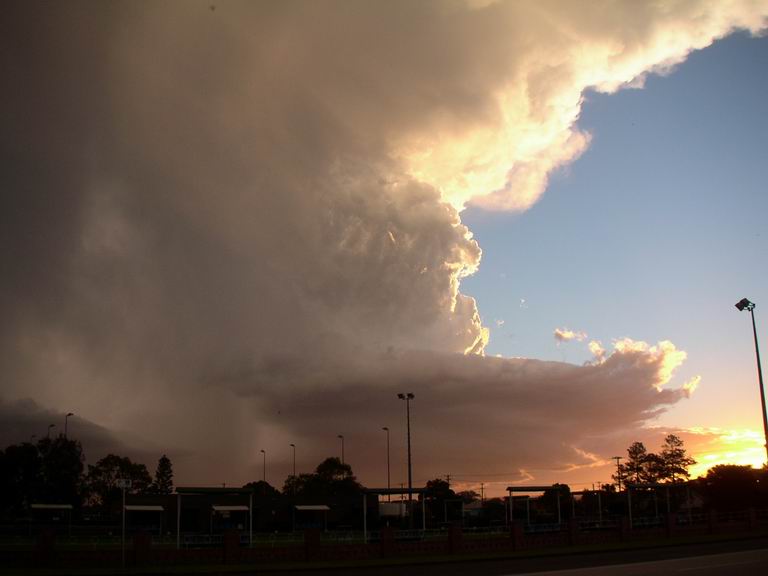
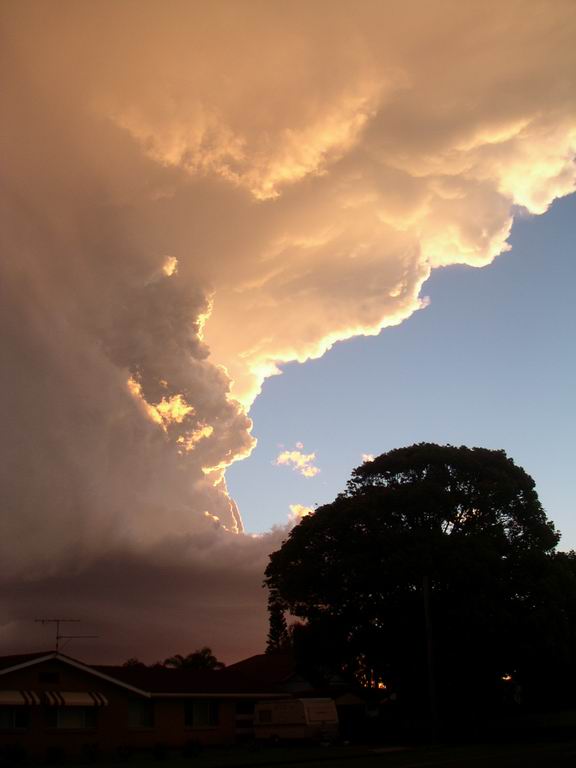
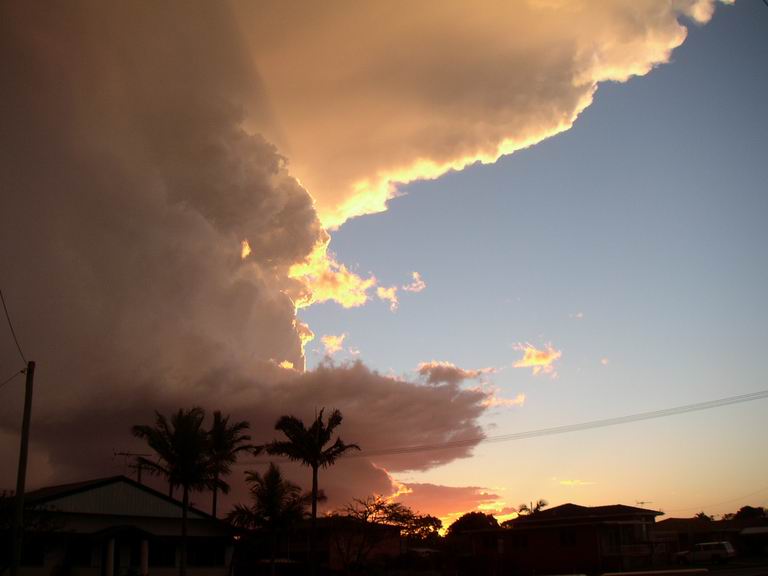
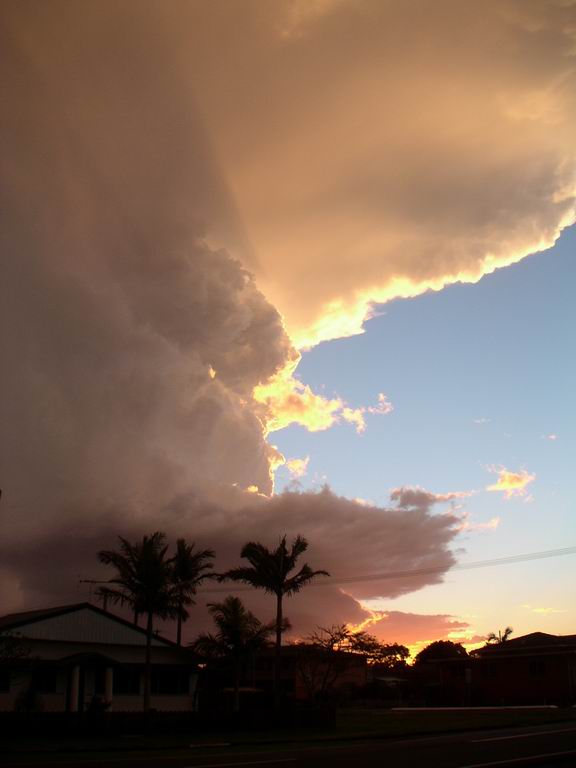
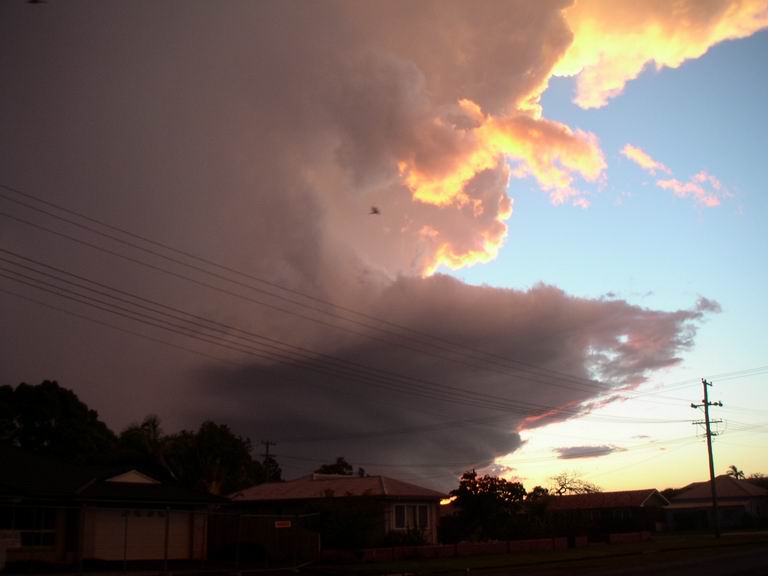
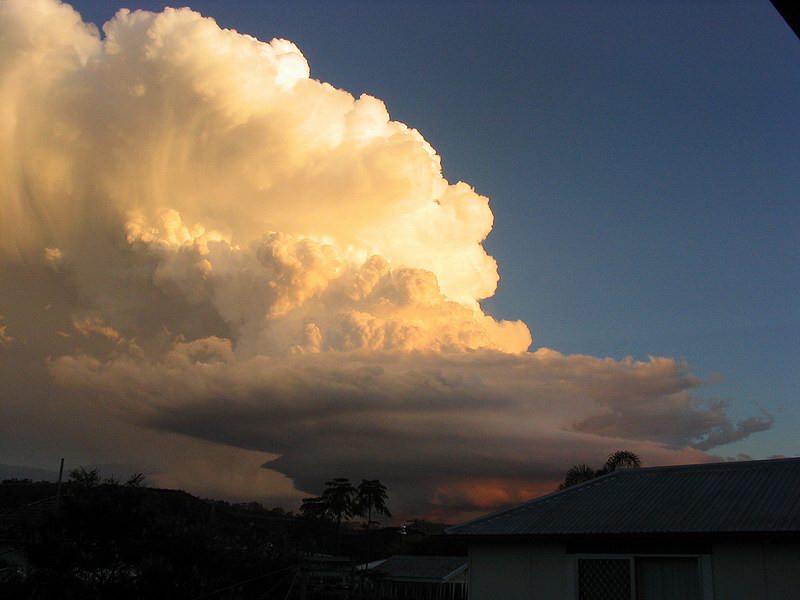
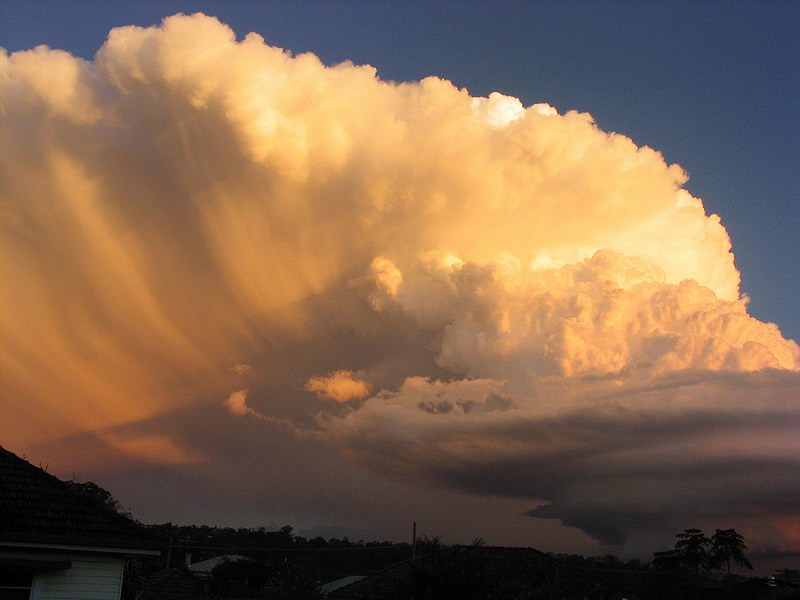
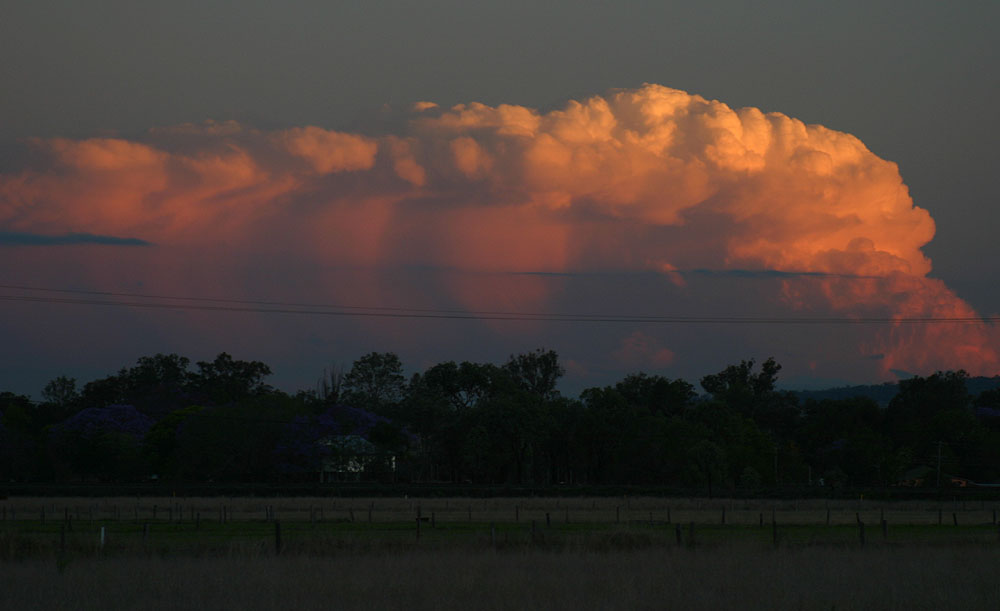
Storm chasers headed to a vantage point just south of Alstonville and were treated to one of the most beautifully structured LP supercells ever recorded in Australia. Hail to 4cm diameter was reported at Wardell and Woodburn. The photographs and video tell the story....
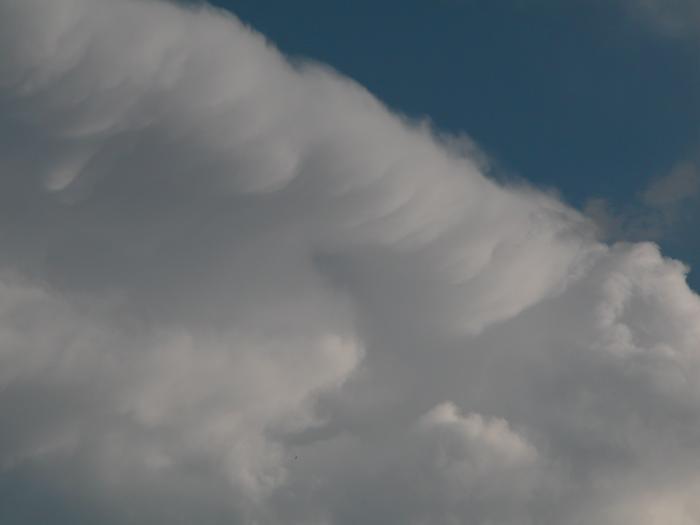
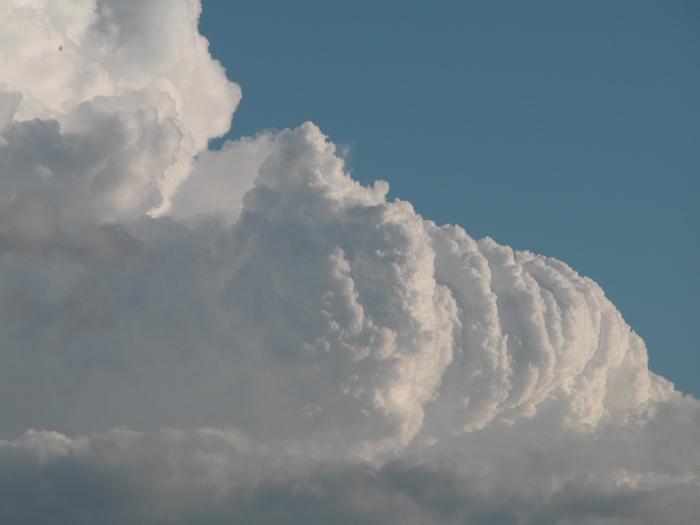
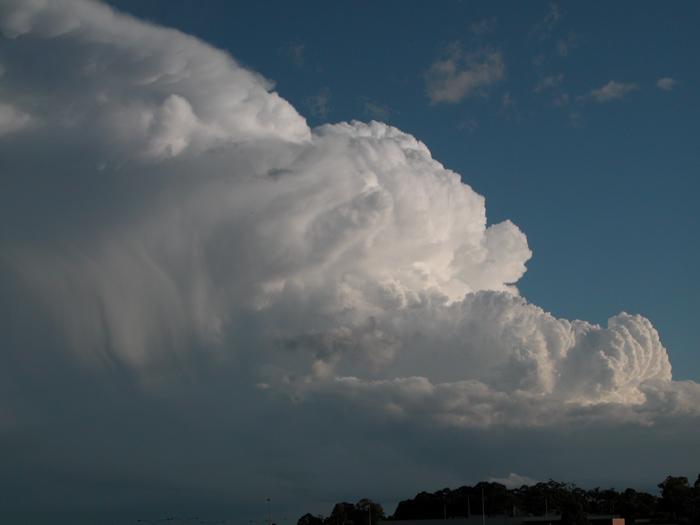
Photographs taken from Wollongbar, Meerschaum and Alstonville by Dave Ellem:


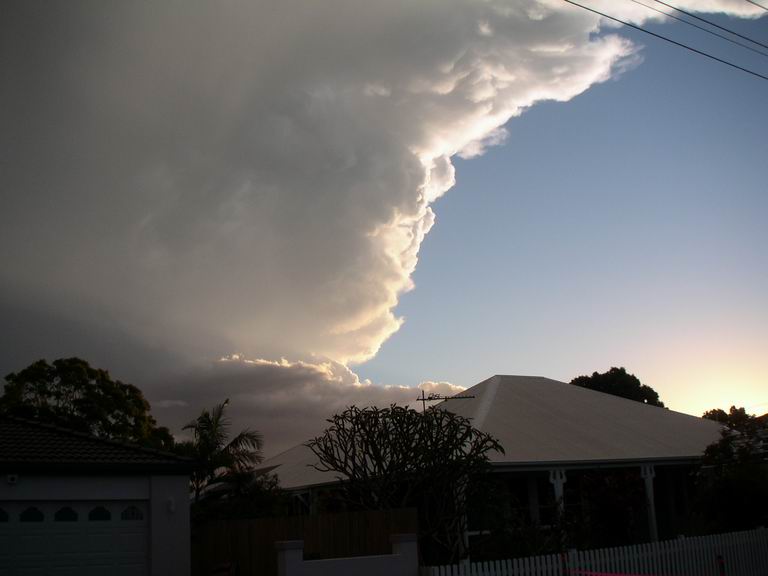
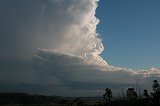
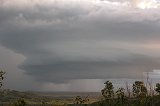
Photographs taken from Goonellabah by Ray Mullens:
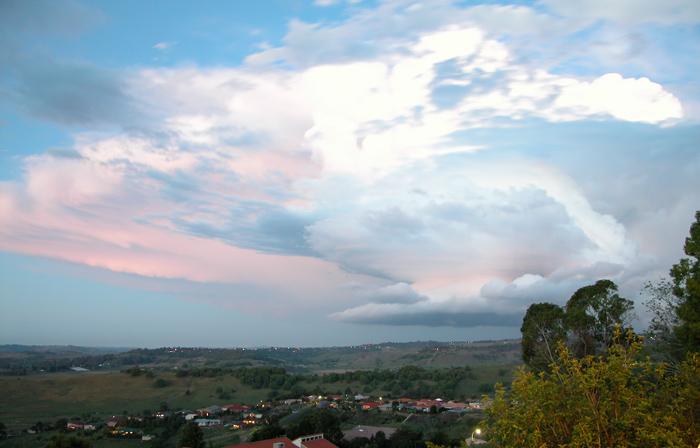
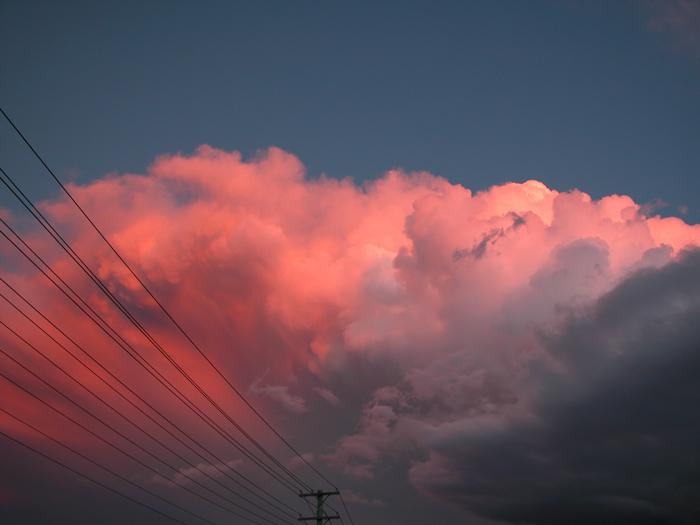
Photographs taken from Ballina by John Bath:
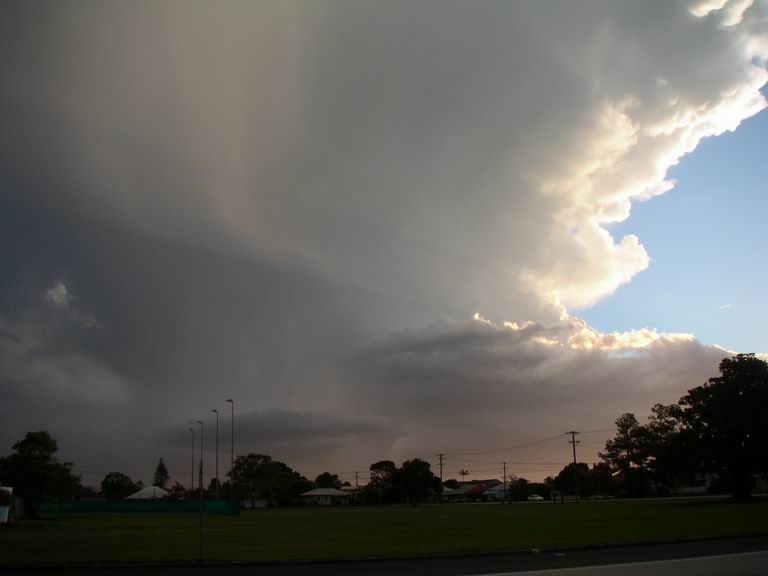
Photographs taken from Lismore looking towards Woodburn by Isaac Smith:
Photograph taken from Rosewood (SE QLD) by Anthony Cornelius:
Video footage taken at Meerschaum by Michael Bath:
 Timelapse sequence 1 [2.1mb]
 Timelapse sequence 2 [957kb]
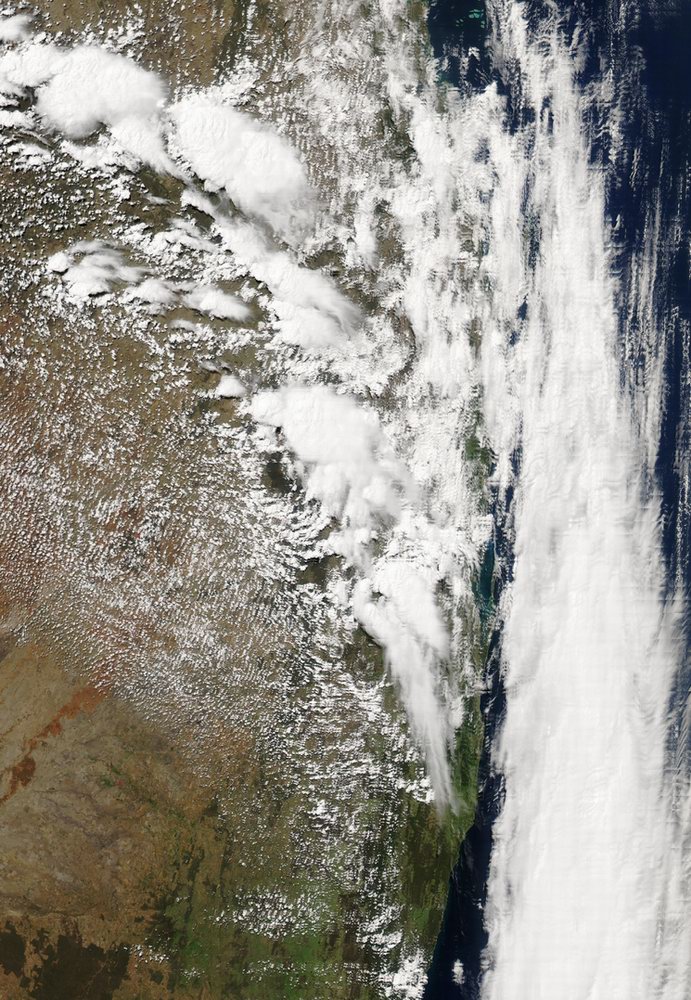
From Bureau of Meteorology.
From Bureau of Meteorology.
Images are at 06 to 10z (4pm to 8pm local)
From Bureau of Meteorology.
From NOAA 20/10/2003 06z analysis run
|
Document: 200310-04.htm
Updated: 22nd April, 2004 |
[Australian Severe Weather index] [Copyright Notice] [Email Contacts] [Search This Site] |