and Chasing
[Index][Archives]
Severe Flooding Isolates Wollongong: Monday 17th August 1998
by Michael Bath
| Storm News and Chasing [Index][Archives] |
Severe Flooding Isolates Wollongong: Monday 17th August 1998 by Michael Bath |
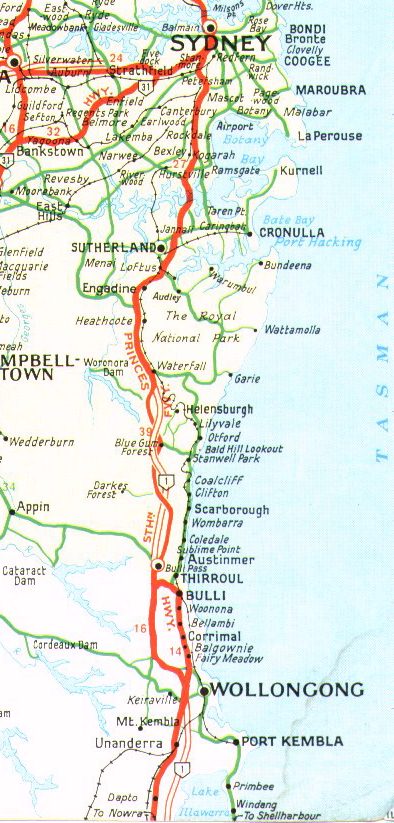
The intense rainfall was caused by an almost stationary trough line. The trough was imbedded in the easterly flow from a strong blocking high SE of Tasmania. The alignment of this trough on the 17th was NNE to SSW from just east of Sydney to the Illawarra Escarpment. It was still persisting just off the coastline (in virtually the same location) on the morning of the 18th, with a spectacular line of thunderstorms on show (refer note below). Convergence along and to the east of the trough generated large cumulus clouds and some cumulonimbus. Winds forced the rain bearing clouds to move towards the SSW-SW along the trough which subsequently moved most of the heavy rainfall over the coastal strip south of Botany Bay and into the Wollongong area (click on the map for locations). Thunder was observed in the Illawarra from mid afternoon on the 17th and continued well into the evening.
During the 18th a small low developed in the trough and maintained the moist flow into the Illawarra. By the afternoon torrential rain was again falling in the Wollongong area, but this time concentrated in the more southern suburbs. Further evacuations resulted, particularly near Lake Illawarra. The rain abating during the night.
Heavy rain again returned to the Wollongong area on the morning of Wednesday the 19th August 1998.
The most intense rainfall occurred late afternoon on the 17th. Figures obtained from Darkes Forest rain gauge show that 110mm fell in 1 hour from 4.56pm. At Bulli Pass to the south, over 150mm rain fell in 2 hours from 6pm on the 17th, with 103mm in 1 hour from 6.22pm. Bulli Pass recorded 210.5mm in 3 hours from 5.06pm and a total of 357.5mm in the 12 hours from 9.55am on the 17th August.
(obtained from Bureau of Meteorology)
Illawarra         16/8     17/8     18/8     19/8
=================================================

Bellambi AWS       101       40      240       75
Berry                     136/3      114      105
Bowral              22       39       61       40
Camden Ap AWS       44       58       50      0.4
Darkes Forest      116       74      271       31
Greenwell Point       	   74/3      117      108
Jervis Bay          16       27       88      163
Kiama               88       20      162      155
Moss Vale           27       34       45       46
Nowra               40       31       82       91
Robertson           66       78      158       90
Wollongong          80       32      316       91

Metropolitan      16/8     17/8     18/8
========================================
Avalon                                34
Belrose             64       30       20
Bankstown           50       58       19
Berowra             35                22
Bexley              81       73
Canterbury AWS      59       50      0.2
Castle Cove         63       56       27
Concord                               24
Castle Hill                68/2
Cronulla                     61
Epping                              44/2
Frenchs Forest      67       28       26
Glenmore Park       23       34       20
Glenorie            29       33        3
Gordon                    113/2       14
Granville           43       39        7
Homebush AWS        49       47       21
Holsworthy AWS      51       61       17
Horsley Park AWS    34       31       18
Liverpool           45       50       21
Lucas Heights       68       62
Merrylands                             9
Mosman              47       30       52
Newport                      36       23
Oatley              88       65       94
Parramatta          42       48
Penrith AWS         18       29        8
Prospect Dam                 34       13
Richmond Ap         23       24        4
Riverview           62       30       15
Rose Bay                     40       76
Seven Hills         29       36
Sydney              54       30       40
Sydney Ap           63       70       54
Turramurra          53       45       18

South Coast                17/8     18/8     19/8
=================================================

Araluen                      43      105       75
Batemans Bay                 39      125
Bega AWS                      9       18       17
Bodalla                    54/3       86       84
Braidwood AWS                12       60       20
Candelo                     8/2       20       14
Eden                                  25       31
Merimbula                     7       18       18
Milton                       42       87      100
Moruya Heads                 14       67       98
Narooma                       6       41       73
Nerriga                      12       26       25
Pambula                     9/3       17       21
Ulladulla AWS                33       82      108
Hourly Rainfall Amounts are available for a number of sites in the affected areas. Figures shown are for Bulli Pass, Darkes Forest, Dombarton Loop, Lake Illawarra and Wongawilli. The data has been obtained from Manly Hydraulics Laboratory and permission has been obtained for its reproduction here.
A report was received during the morning of 18th August from Michael Thompson who lives at Shellharbour, south of Wollongong city (click the link for his report on the event):
"But I did see some sobering sites at Allens creek, this was the creek I saw the car bobbing around in last night. The creek is now well within its banks, but mud and debris are everywhere, along with a dozen drowned cars, with mud and grass over them from top to bottom. A couple look like they had been doing some bumping around as well. The bridge guard rails have reeds and rubbish about 2-3ft above road level, but the bridge itself is 3-4 ft above the road either side. Evidence indicates that the water was a torrent."
"One poor girl at work here, who lives beside a 'natural watercourse' at Corrimal was evacuated at 9pm last night when her house was knee deep in water, the water got to chest deep during the trip from her house to the emergency vehicles. She has not seen the house yet, and expects the worst. It is only one of numerous houses that would have been in a similar situation."
"Lake Illawarra is about 18 inches from flooding, but I'm 99% sure it will not get there. The caravan park residents are extremely lucky as only the northern creeks of Lake Illawarra hit huge flood levels. Had the same event been located 20 kms further south Mullet Creek and Macquarie Rivulet, whose catchments are larger would have been involved and the Lake would have went easily 2-3ft deeper. You can see this if you compare the Manly Hydro gauges at Bulli Pass with Wongawilli and Yellow Rock. The latter two being Mullet Creek and Macquarie Rivulet respectively."
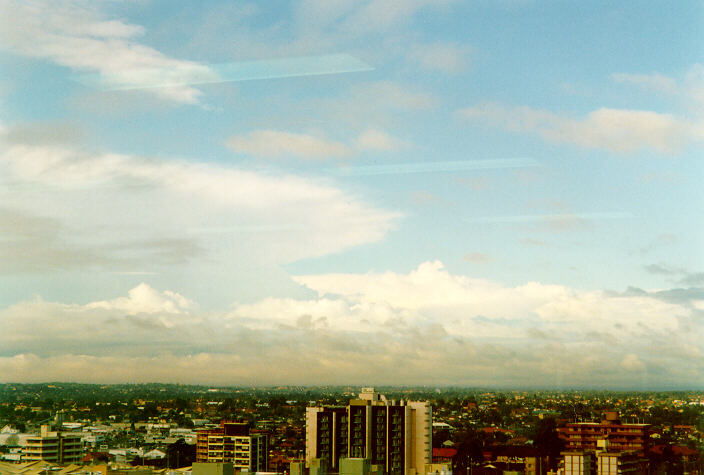
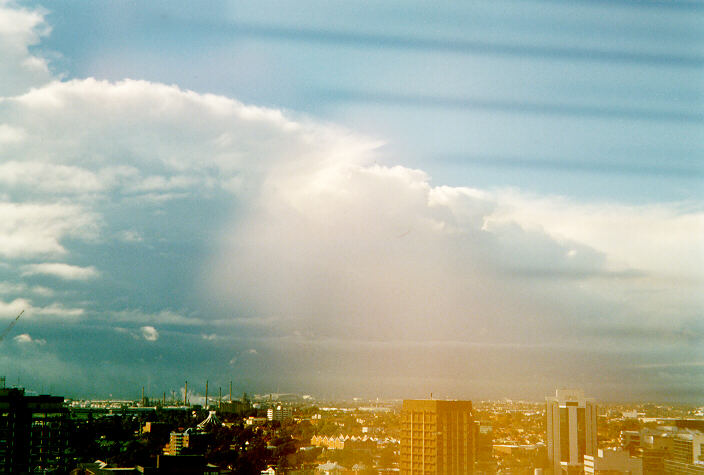
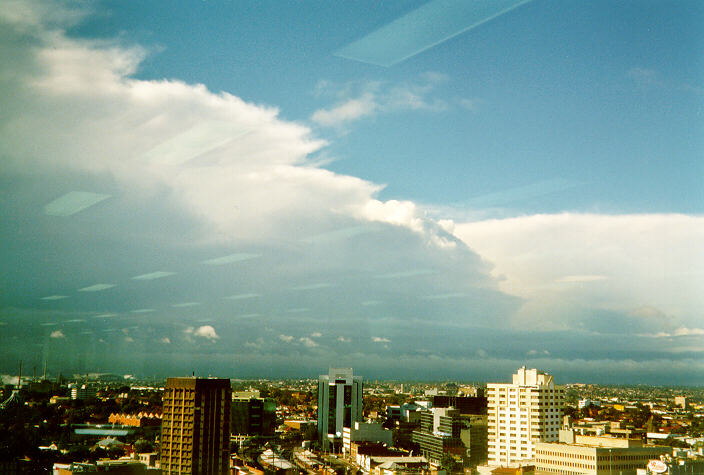
The thunderstorms as viewed from Parramatta between 8.30 and 9.00 am. Photos by Michael Bath
Don White reports:
"Narrabeen Lagoon AWS had 43 mm in the hour from 6.45 and Mona Vale 41 mm in the hour from 6.43 am. The heaviest rain was in the Collaroy - Dee Why area - the cinema in Collaroy was flooded to a depth of 2 metres and there was major beach erosion caused by almost 1 metre of water flowing across Pittwater Rd from Collaroy Plateau and over the beach. It must be rare from beach damage on the east coast being caused by freshwater flowing from the land out to sea."
"My recorder at Collaroy had 123 mm in 90 minutes from 7.30 am when he measured to 9 am when the rain stopped. His estimate of 100 mm in 40 minutes from 7.30 could be taken as fairly reliable - he is an interested weather watcher and has been recording rain for me for 20 years."
"The 'storm' hugged the coast further south - Little Bay had 49 mm in the hours from 7.03 am as well."
This image obtained from the Bureau of Meteorology
MSL Analysis 4pm 17th August Local Time
These images obtained from James Cook University
Infrared Satellite Images at 1pm, 4pm, 7pm and 10pm on 17th August Local Time.
|
Document: 9808-01.htm
Updated: 14th January, 2003 |
[Australian Severe Weather index] [Copyright Notice] [Email Contacts] [Search This Site] |