and Chasing
[Index][Archives]
Severe pulse storms explode the cap over the Wollemi National Park: Saturday 14th January 2006
Report compiled by Jimmy Deguara and Michael Bath
| Storm News and Chasing [Index][Archives] |
Severe pulse storms explode the cap over the Wollemi National Park: Saturday 14th January 2006 Report compiled by Jimmy Deguara and Michael Bath |
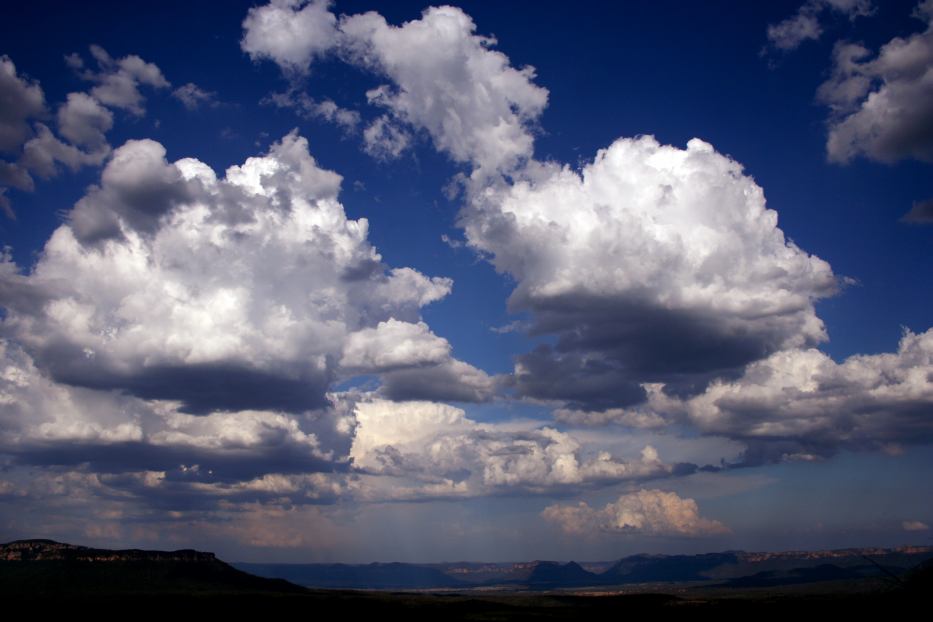
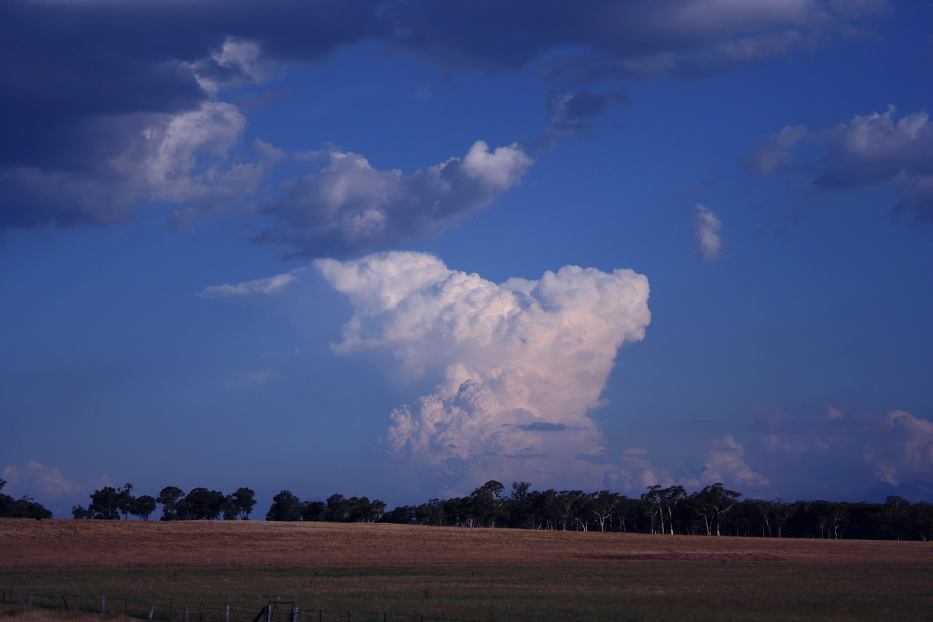
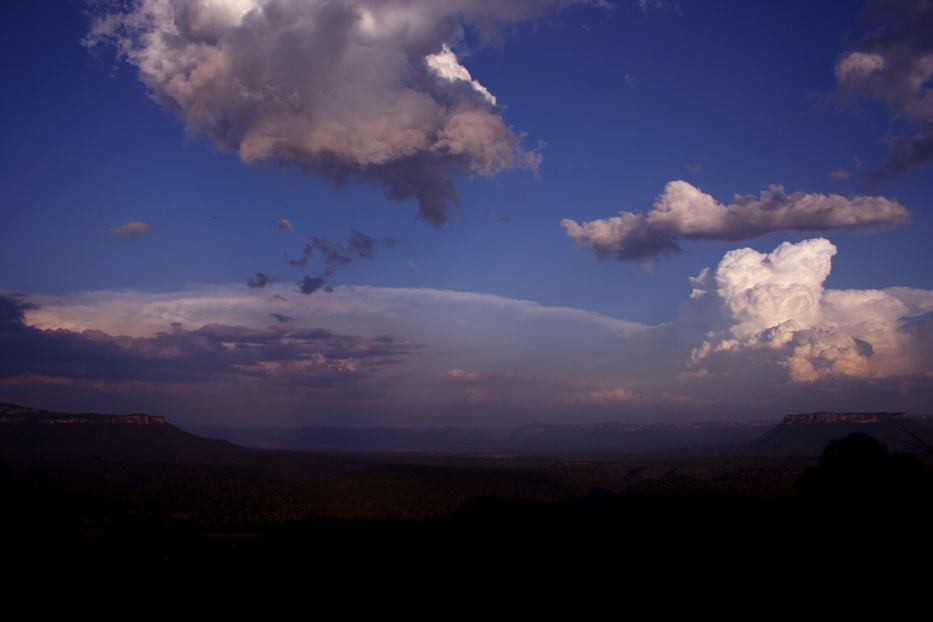
This event proved to be a test of patience as well a chase gamble. Do we head north along the Putty Road or northwest along the road to Mudgee? We opted for the road to Mudgee given the windshear profile favoured storms moving north. Where storms would initiate was a gamble. Finally at 5pm, the first weak convective tower broke through! Subsequent towers were stronger which was encouraging.
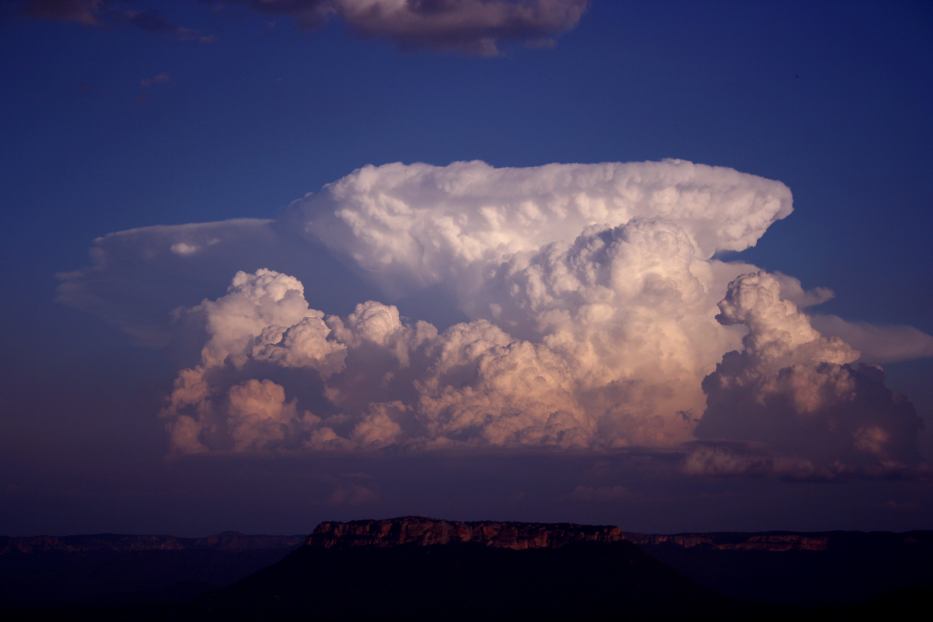
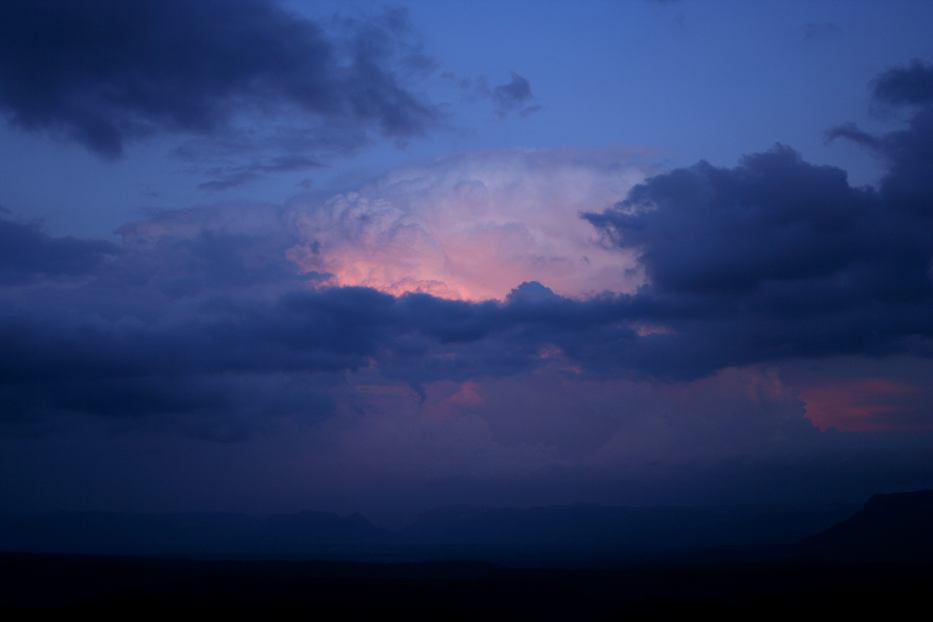
Unfortunately though, they were in no man's land (you guessed it along the Putty). This storm continued to mature and from our lookout the tower exploded into a spectacular massive anvil. The setting was perfect: storm superimposed on spectacular golden cliffs reflecting the setting sun!
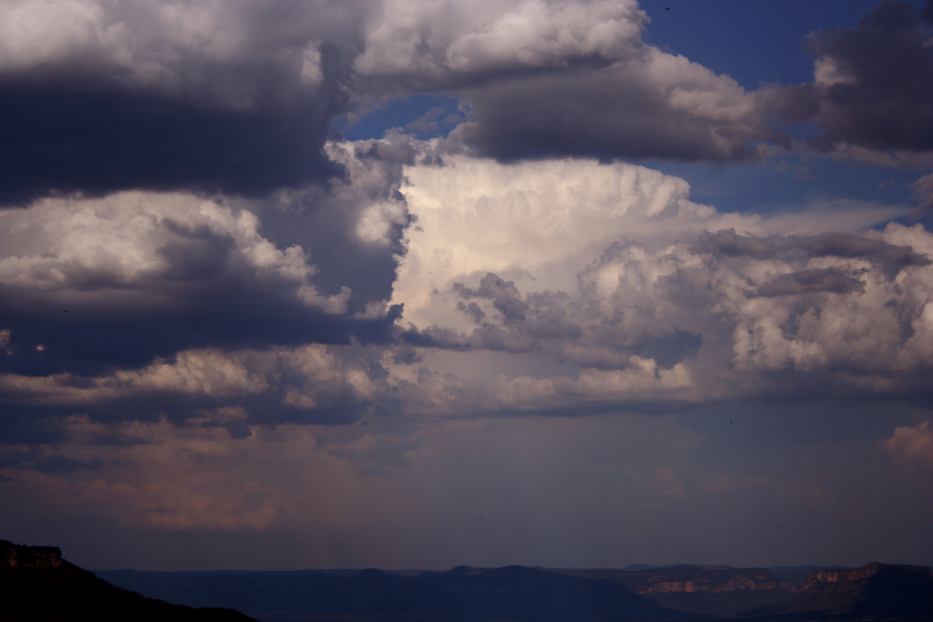
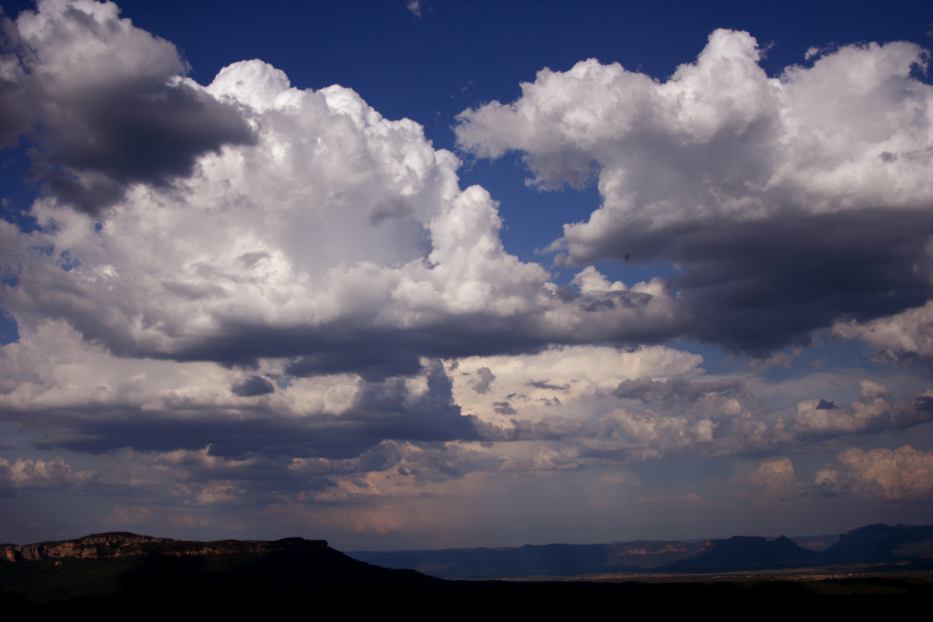
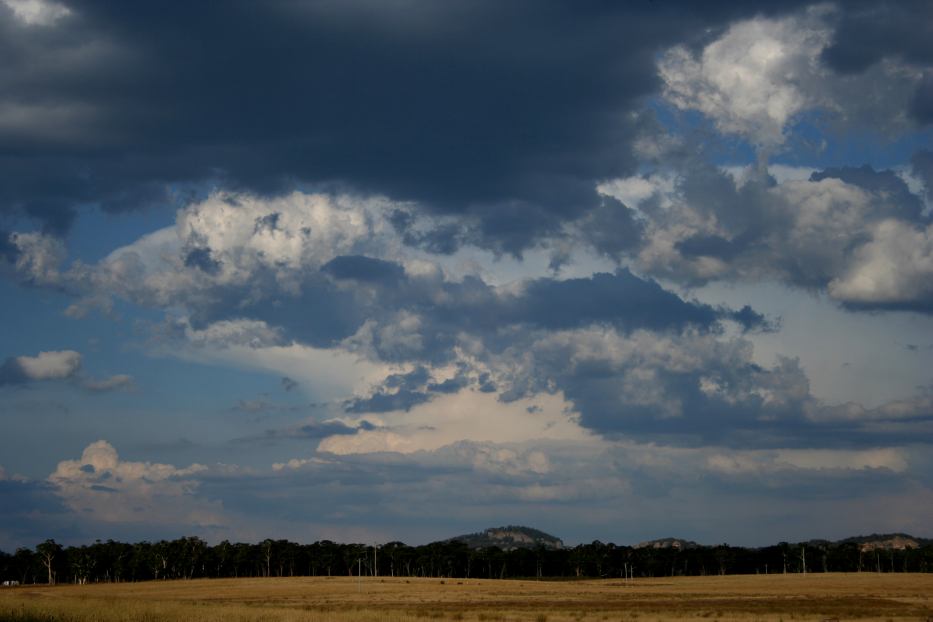
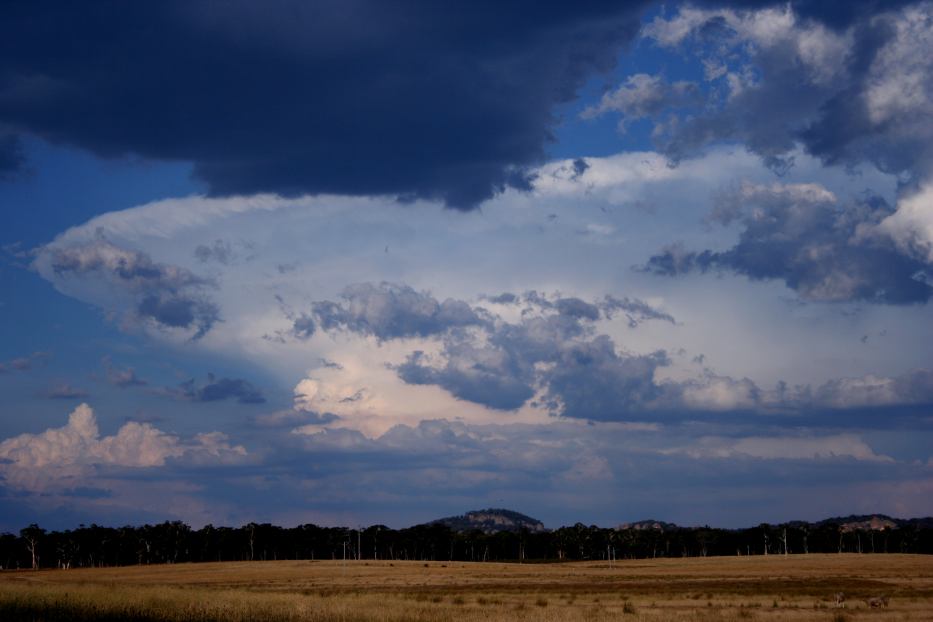
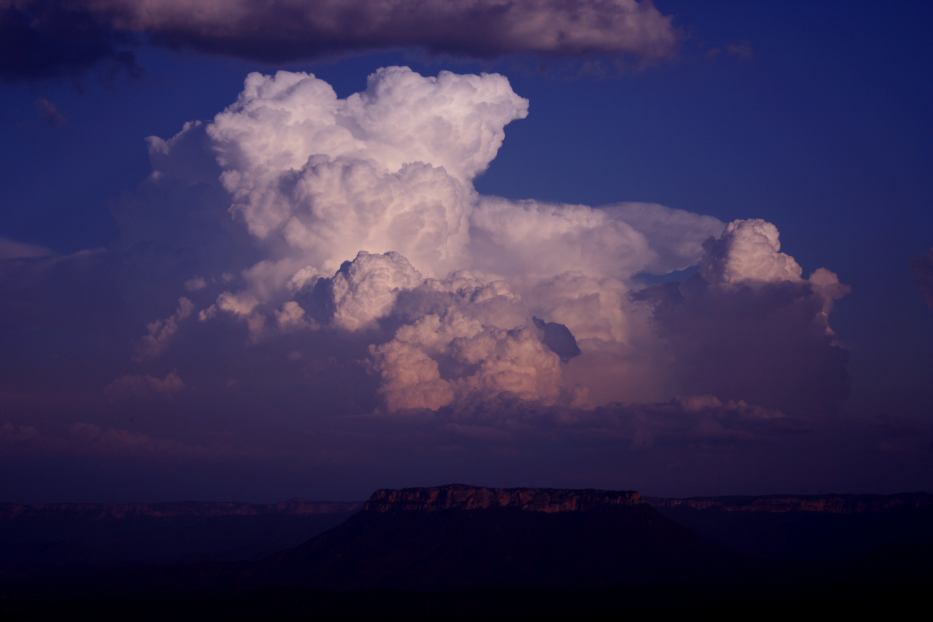
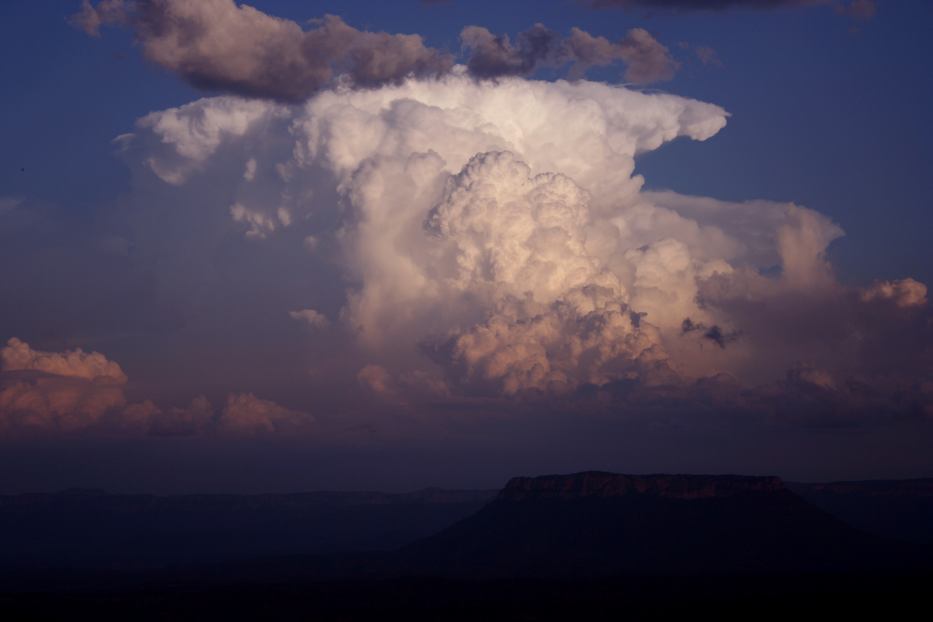
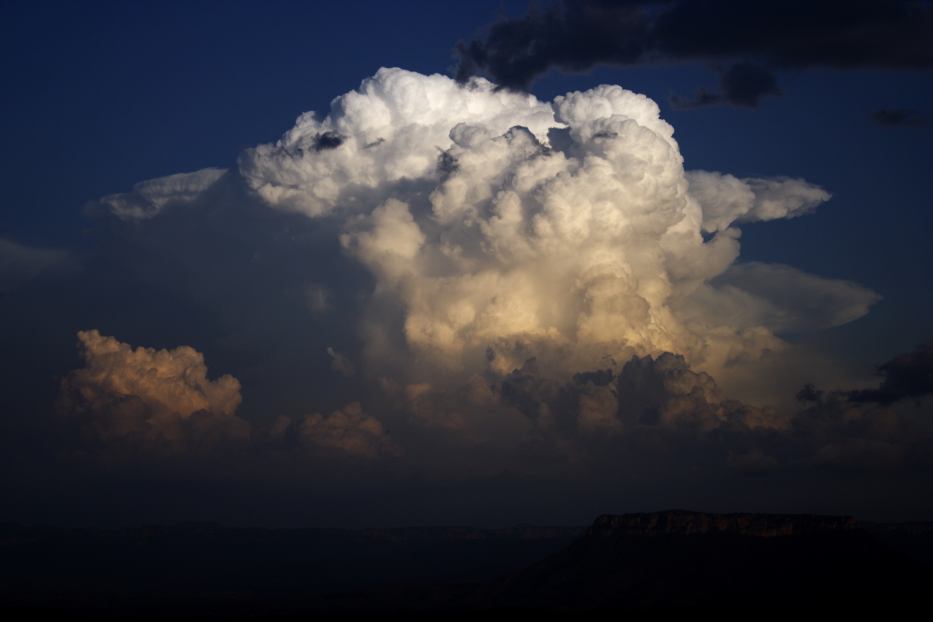
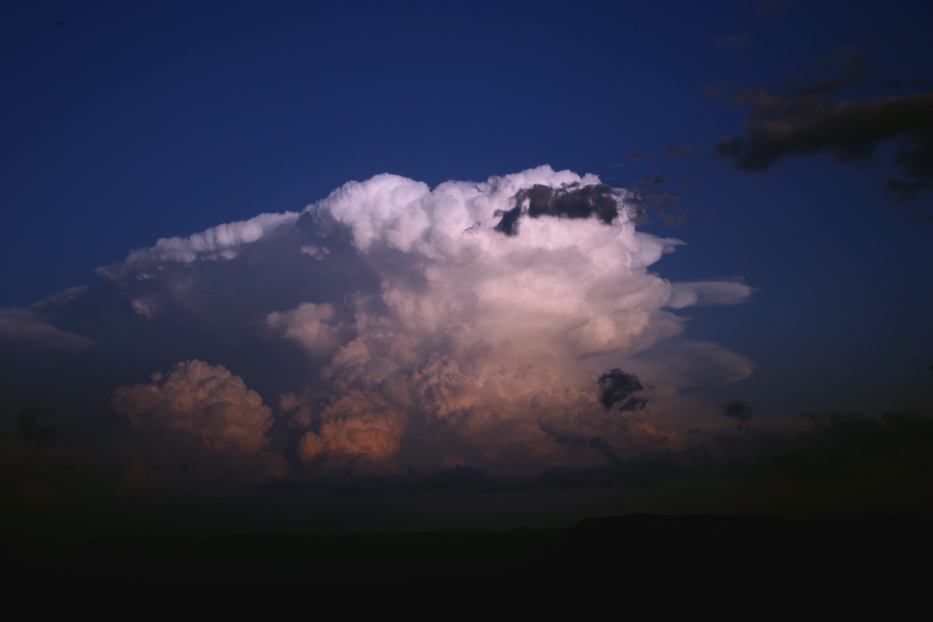
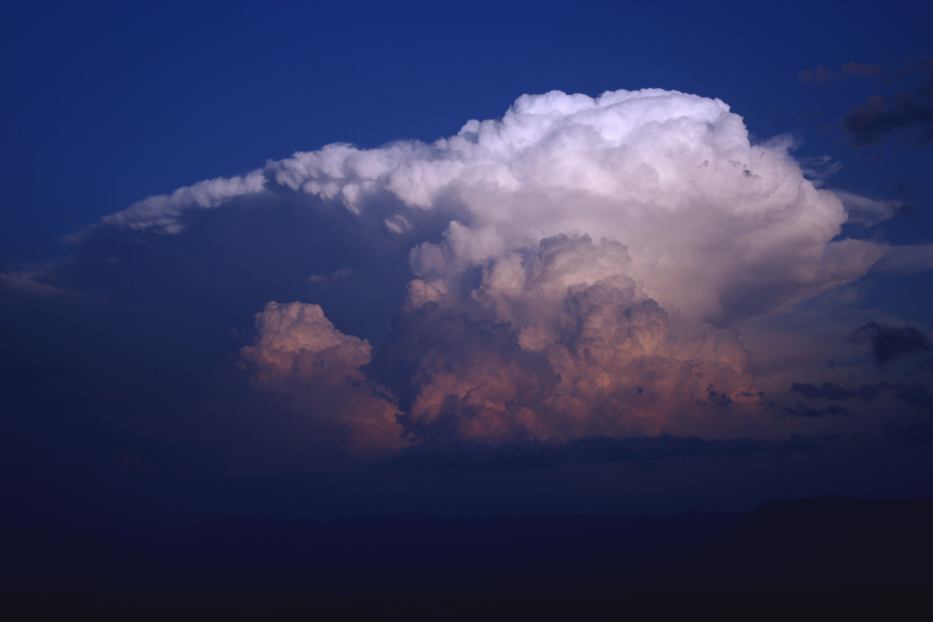
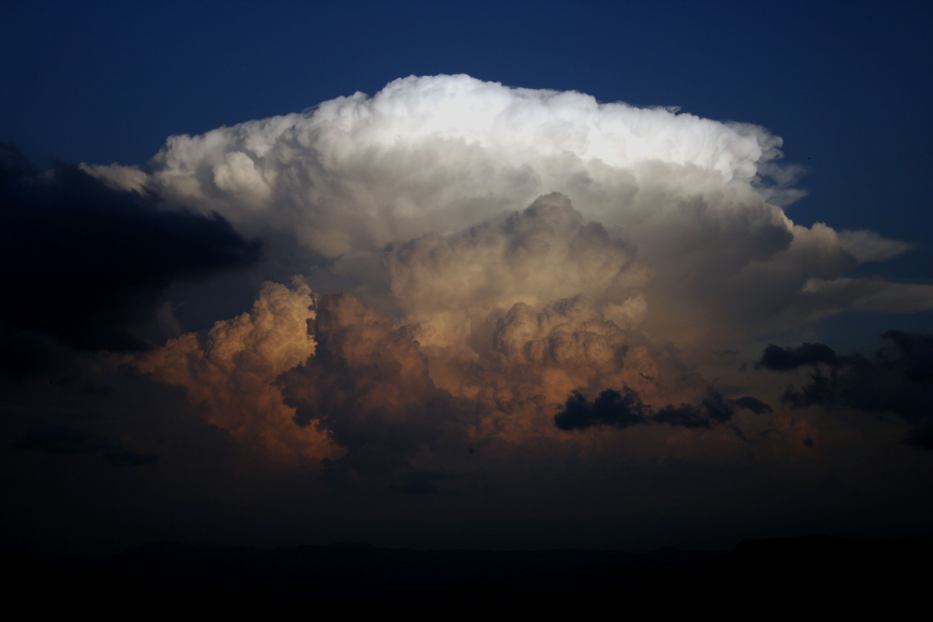
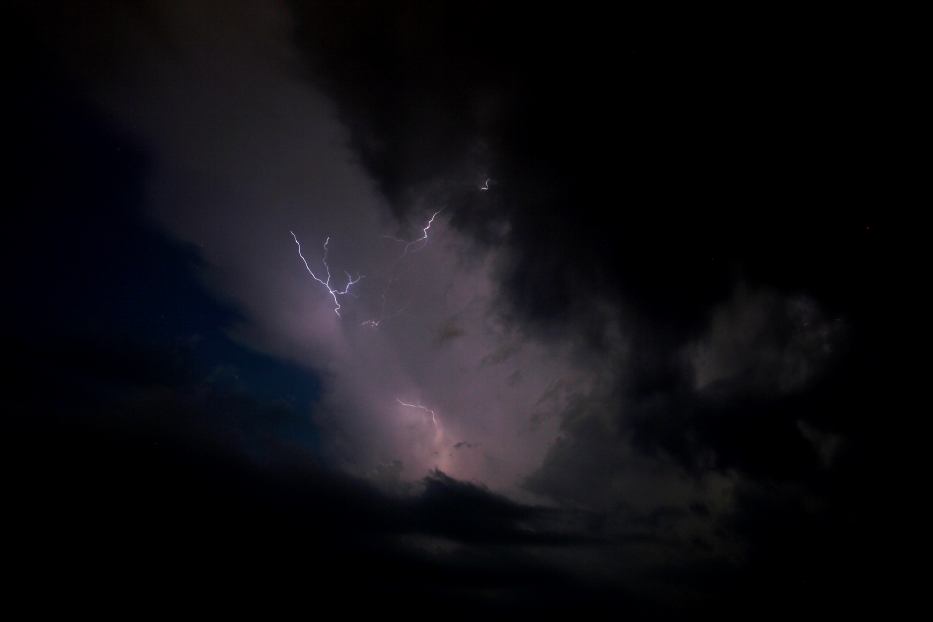
The storm moved ever so slowly in a general north direction. A weak storm to the southeast also began to consolidate - each updraft punching higher towards the tropopause. With clouds covering our view of the northern storm, this new storm stole the show.
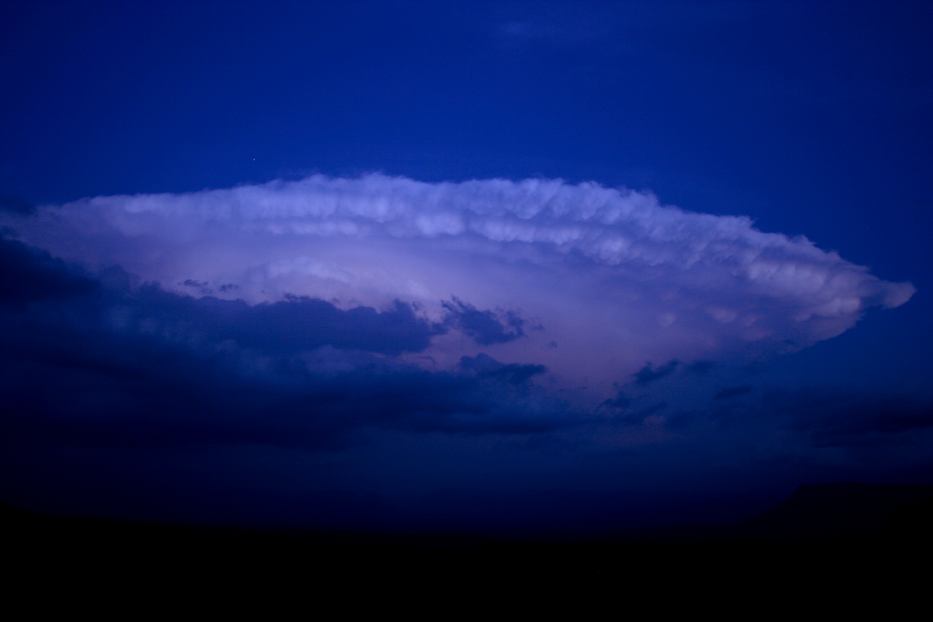
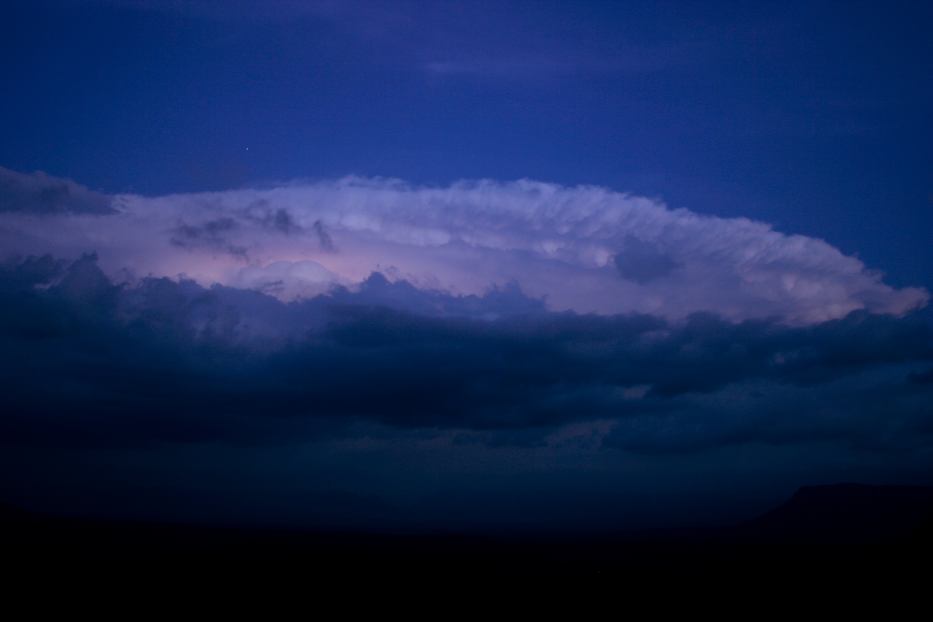
Cloud to cloud lightning bolts could occasionally be seen connecting the anvil to the updraft. This turned out to be a very relaxing session - peaceful surroundings and a storm to boot!
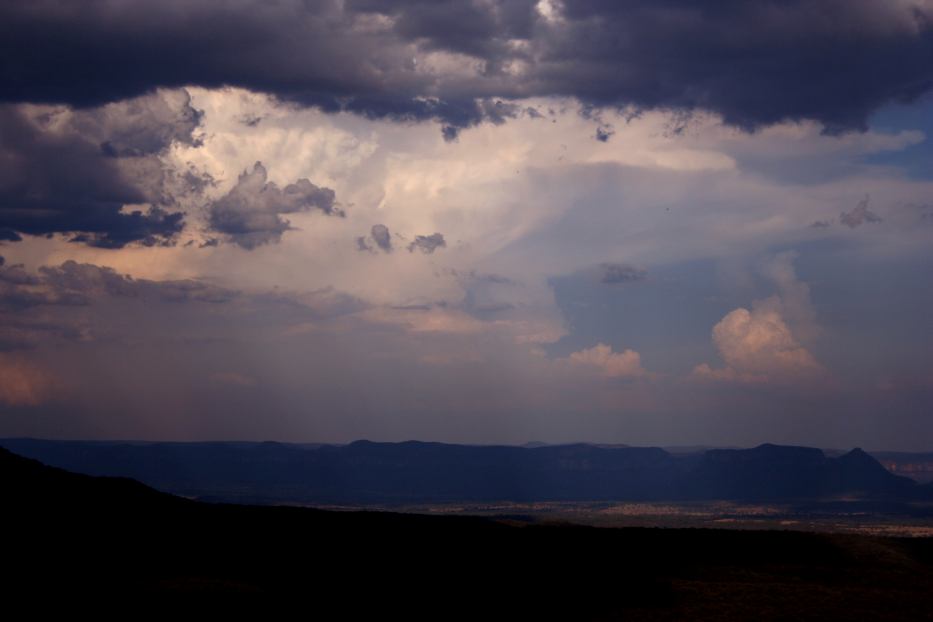
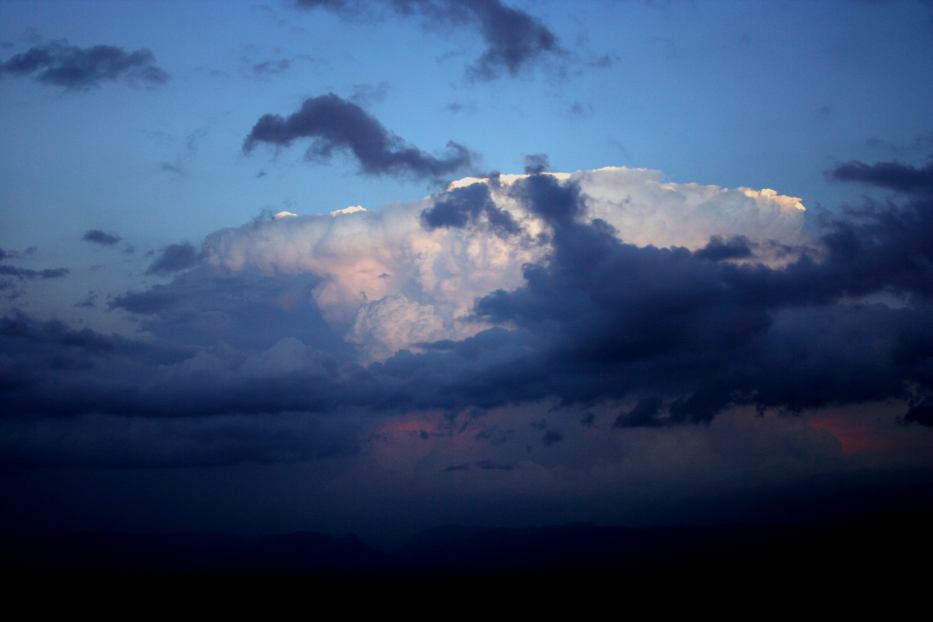
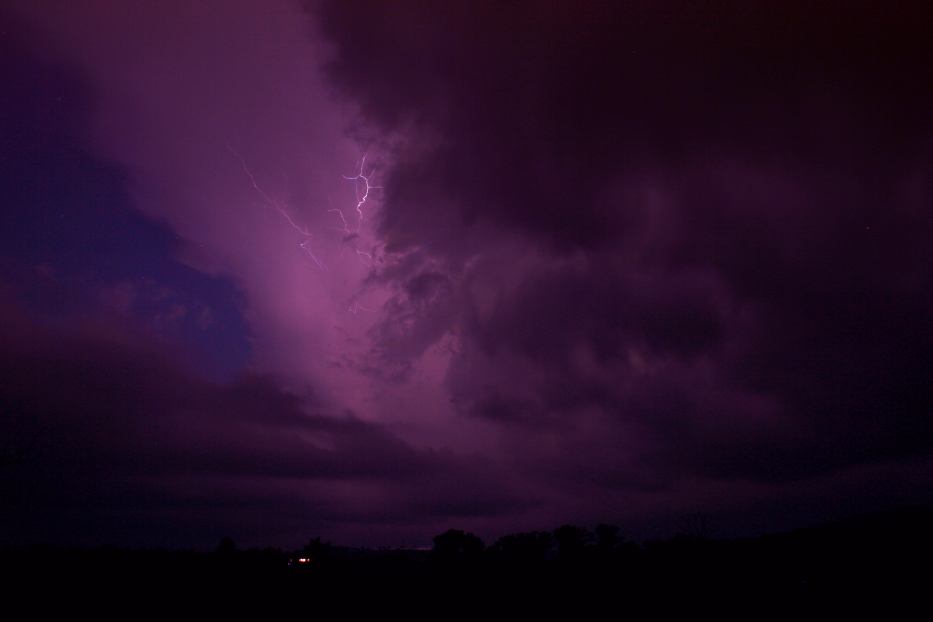
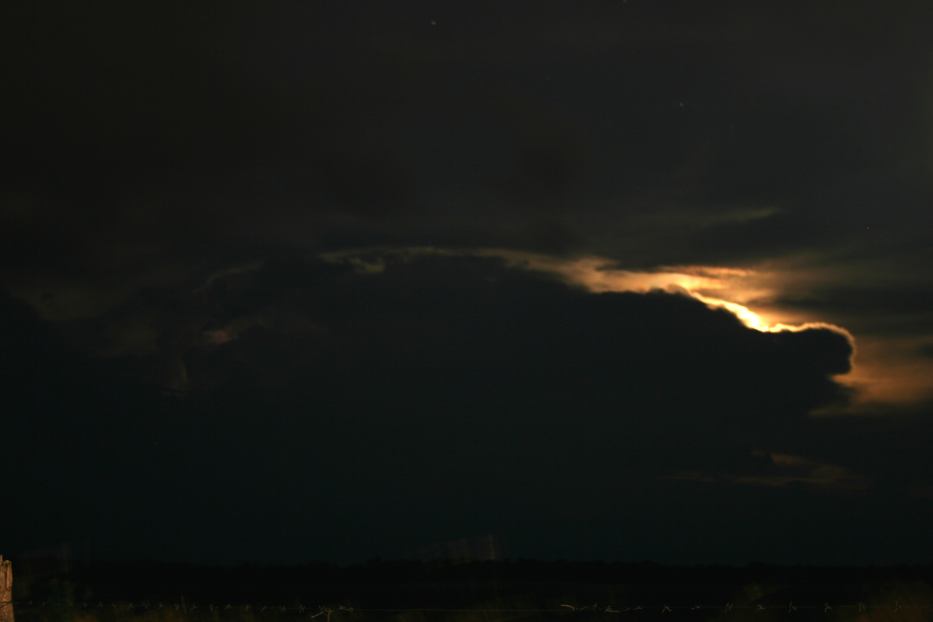
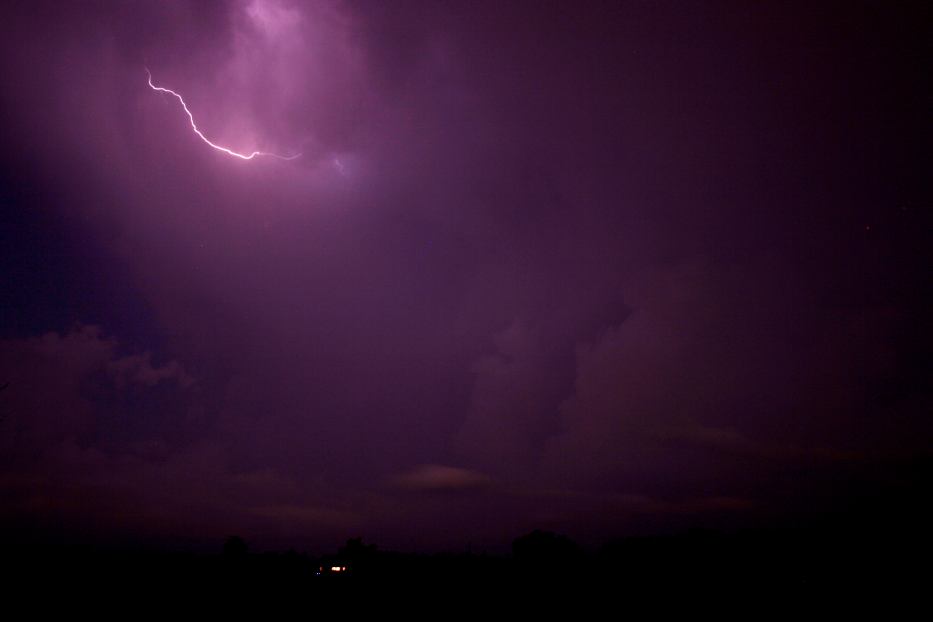
Night time and low cloud signalled our move to a more favourable location. A flash lit the sky! But this was not from the same storm! The westward moving moist boundary had initiated another storm to our west. Spectacular bolts singed the earth on at least 3 occasions whilst in transit. Once stopped, so did the storm!
From Bureau of Meteorology
 5pm to 11pm local
From Bureau of Meteorology
 Williamtown sounding at 11am 14/01 local
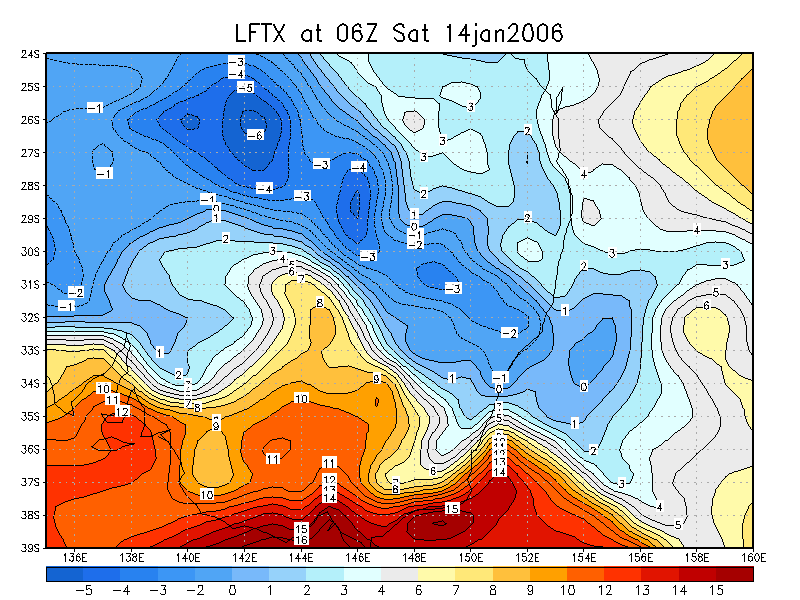
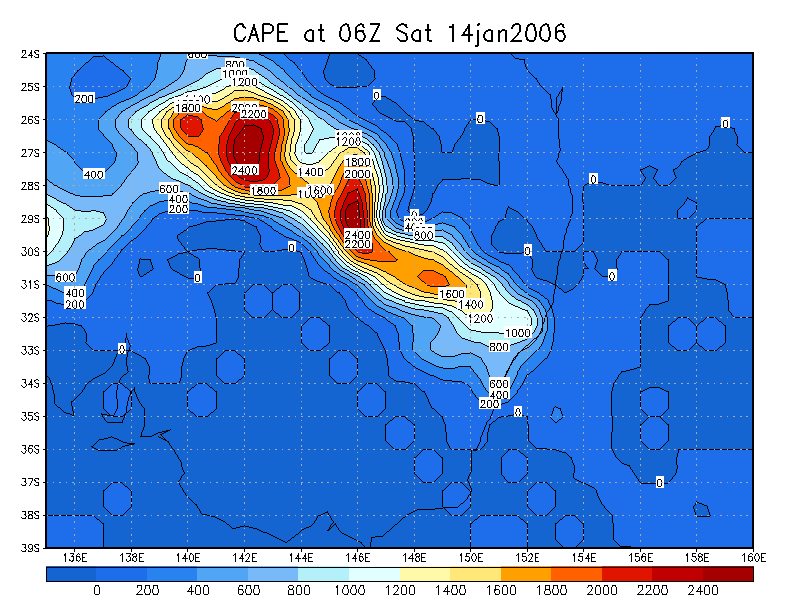
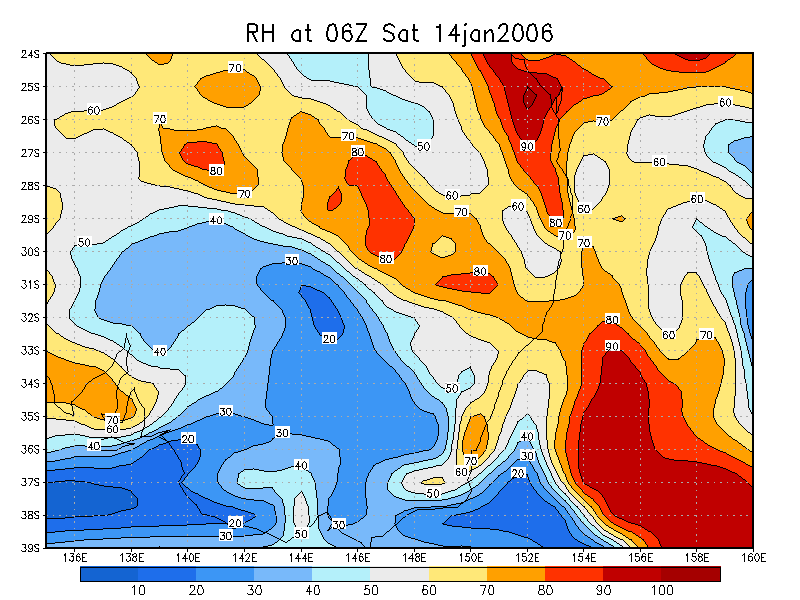
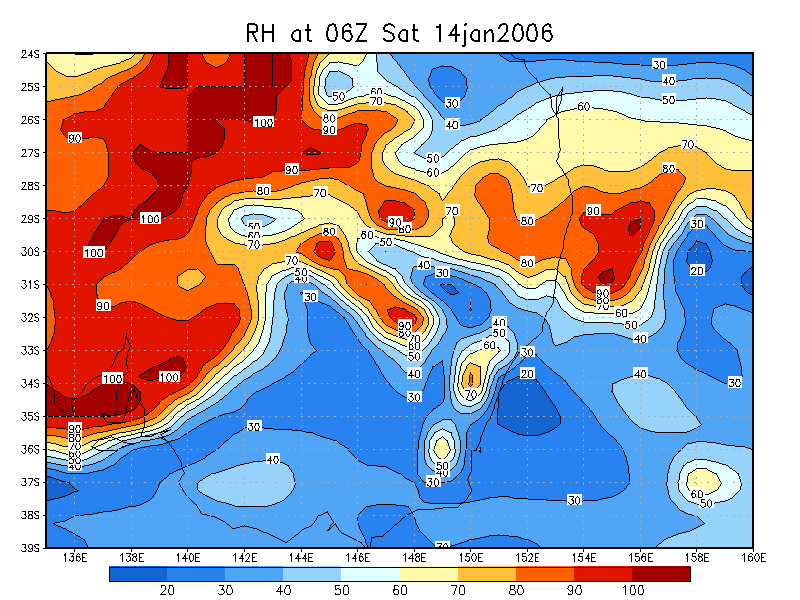
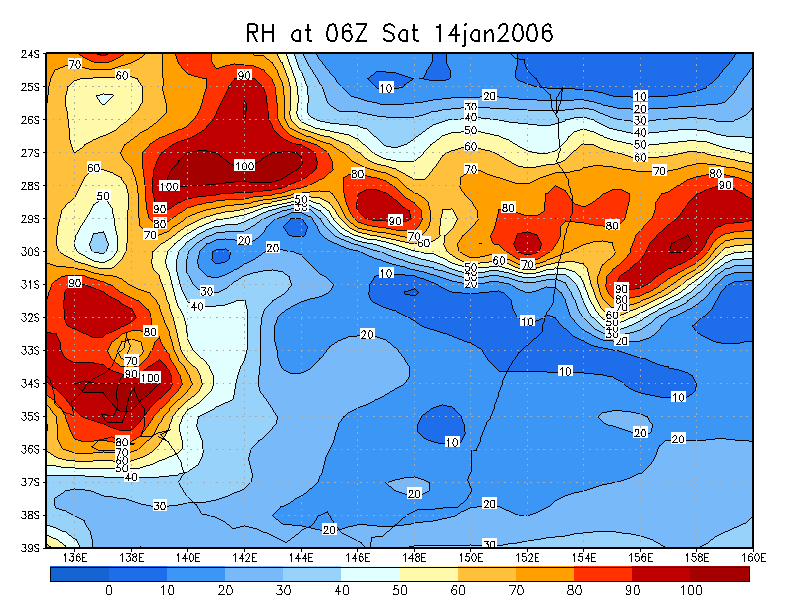
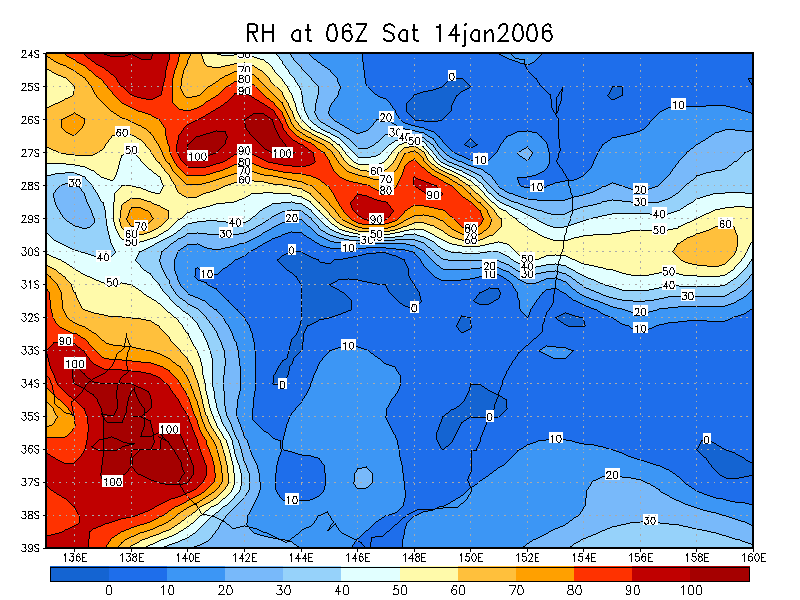
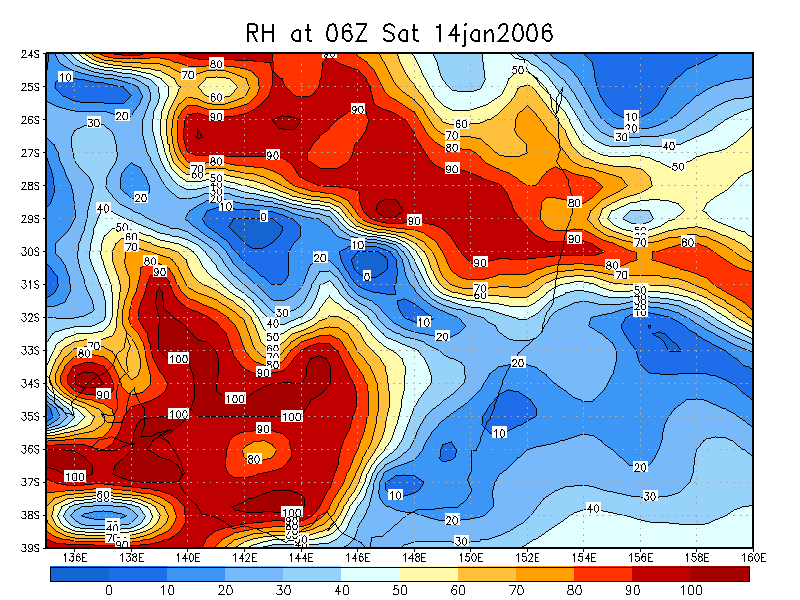
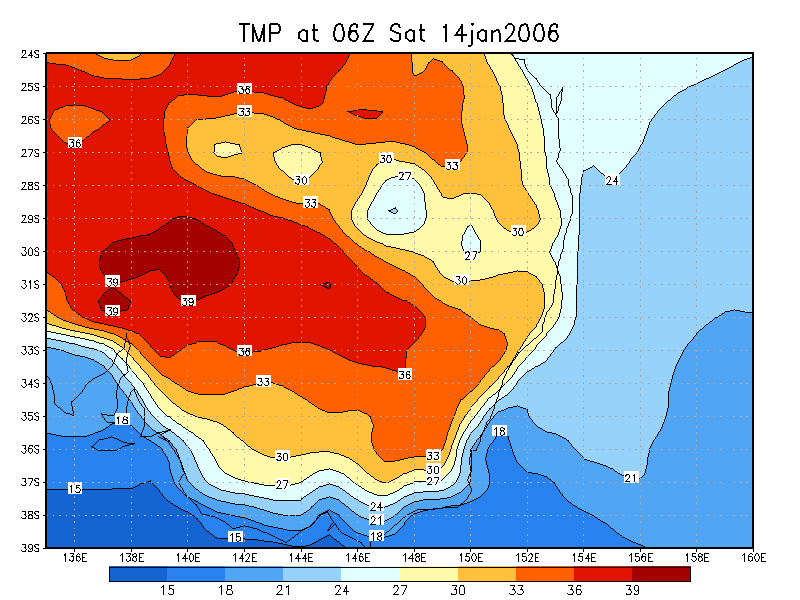
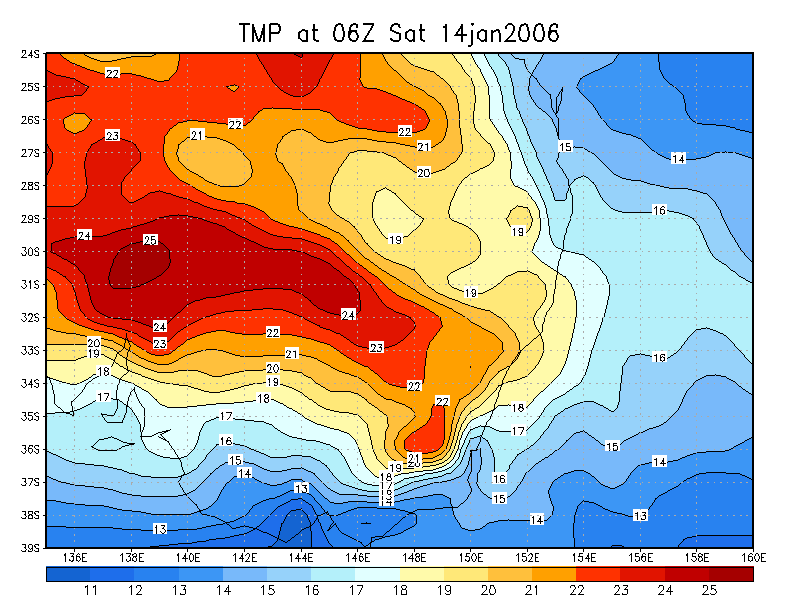
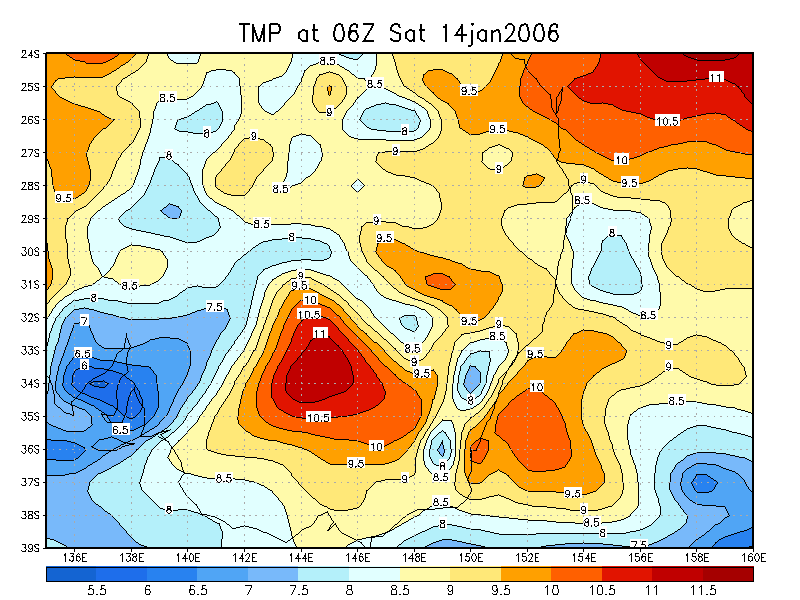
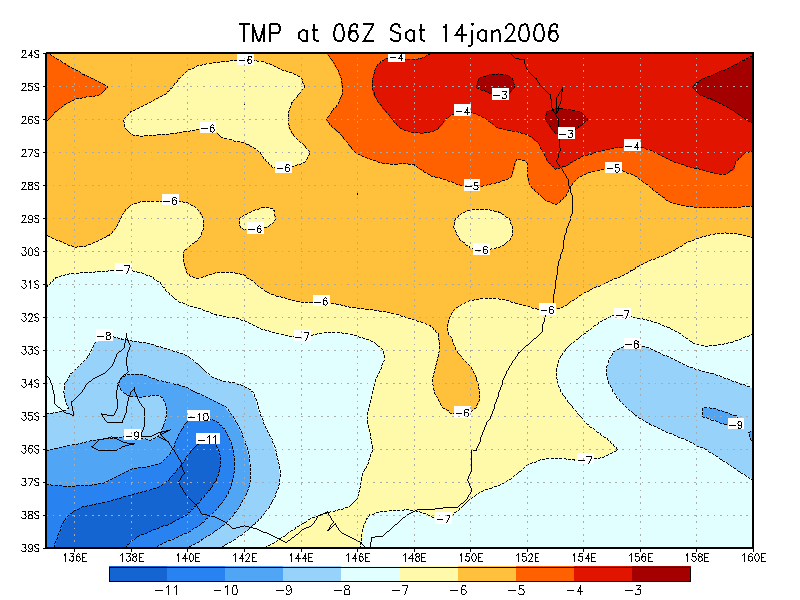
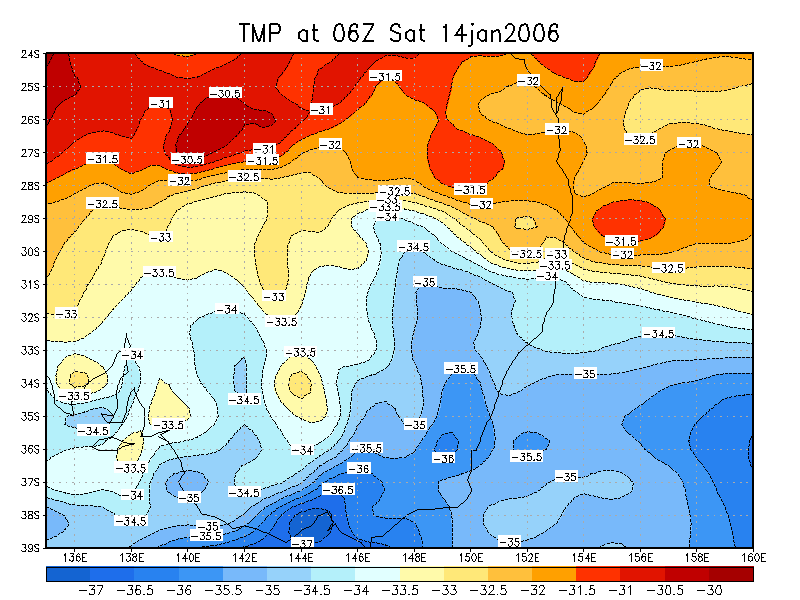
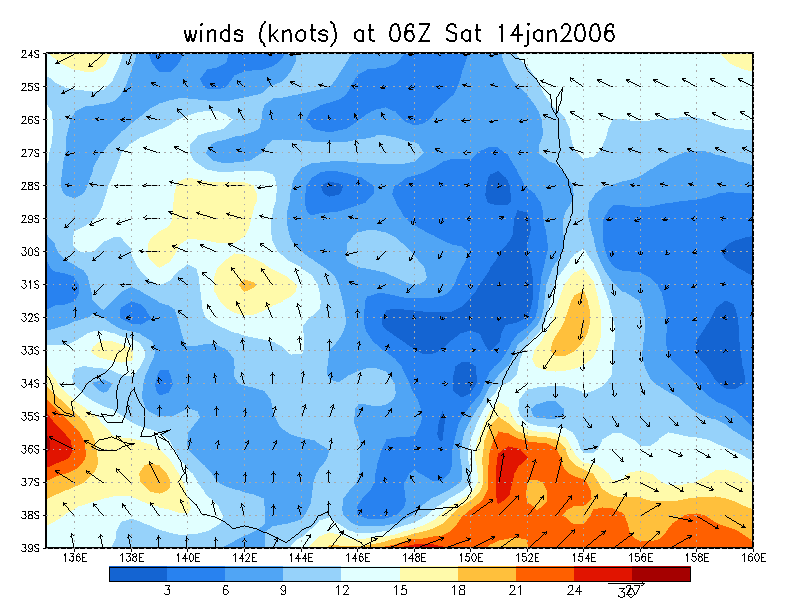
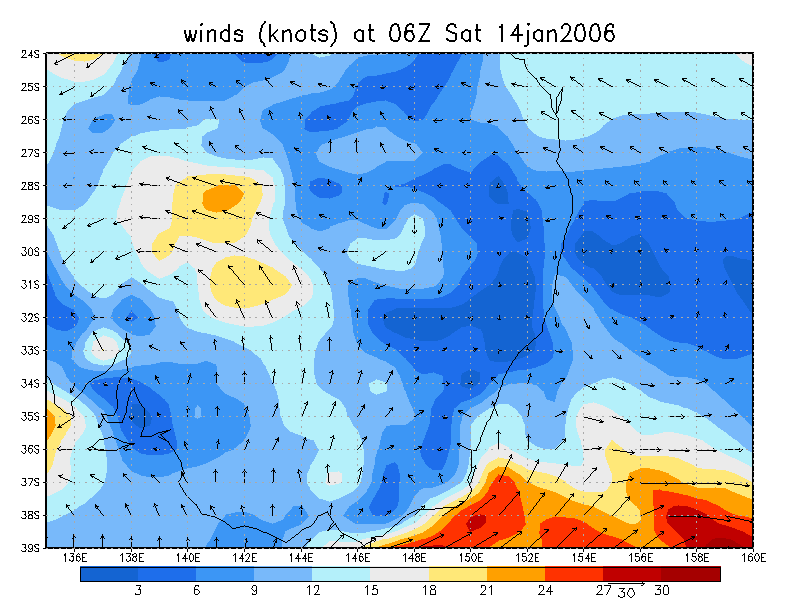
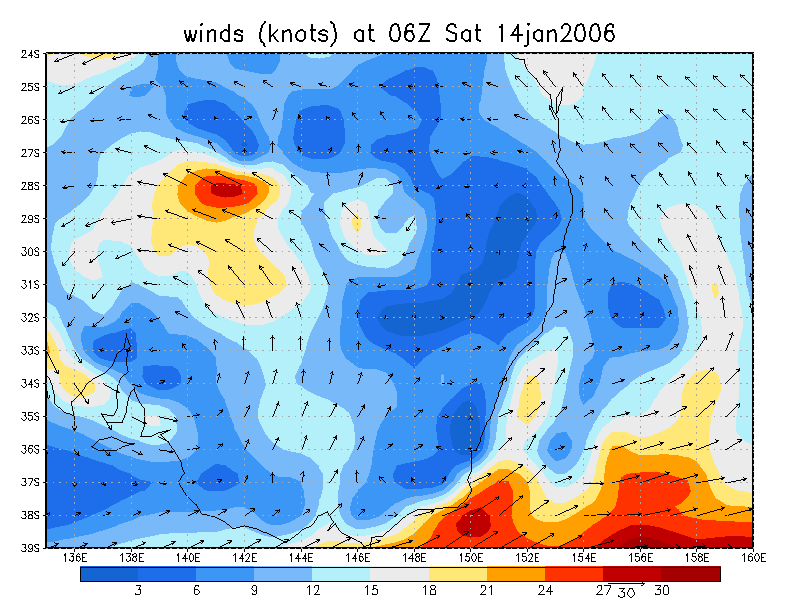
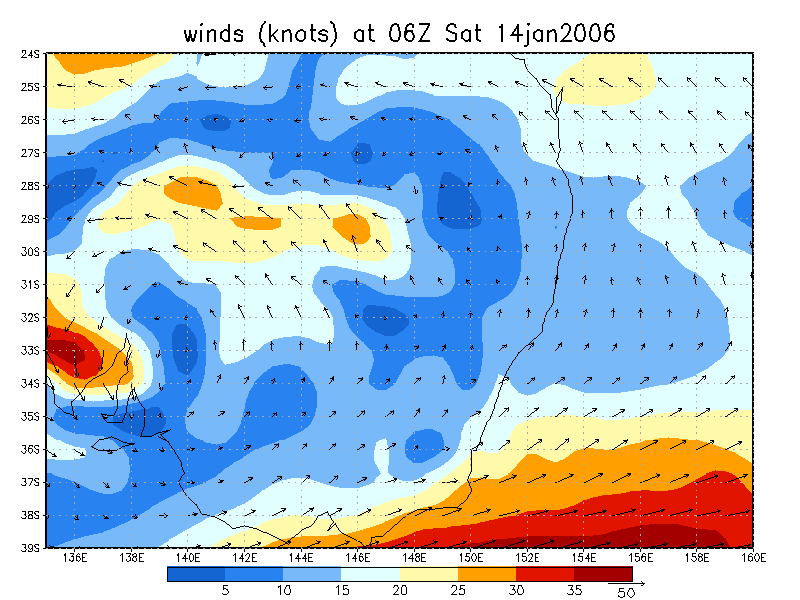
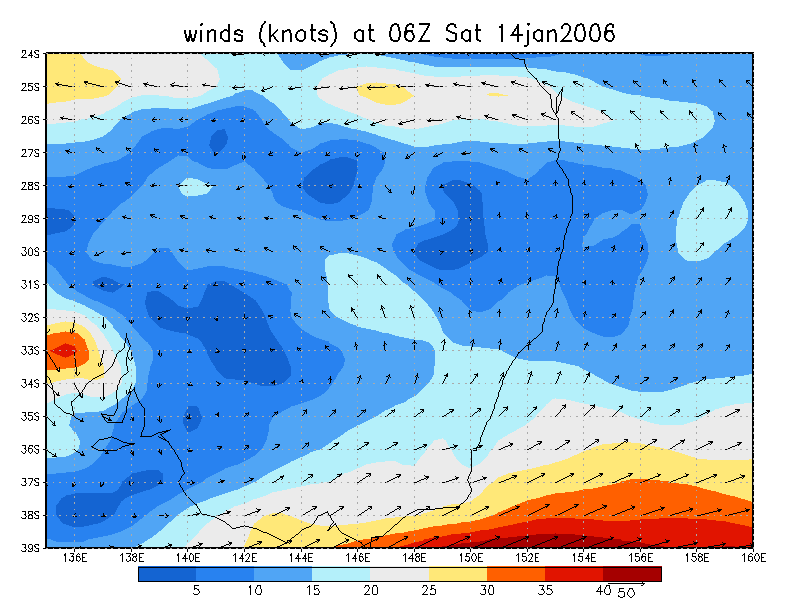
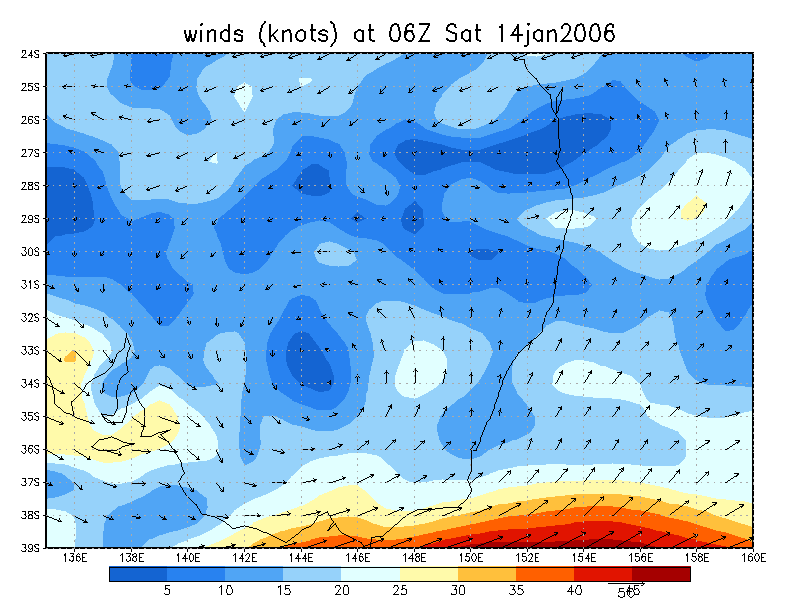
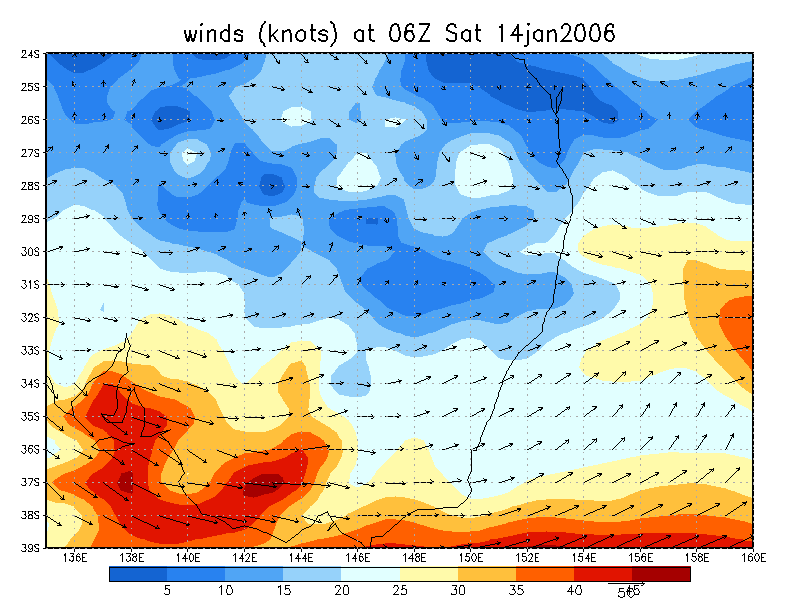
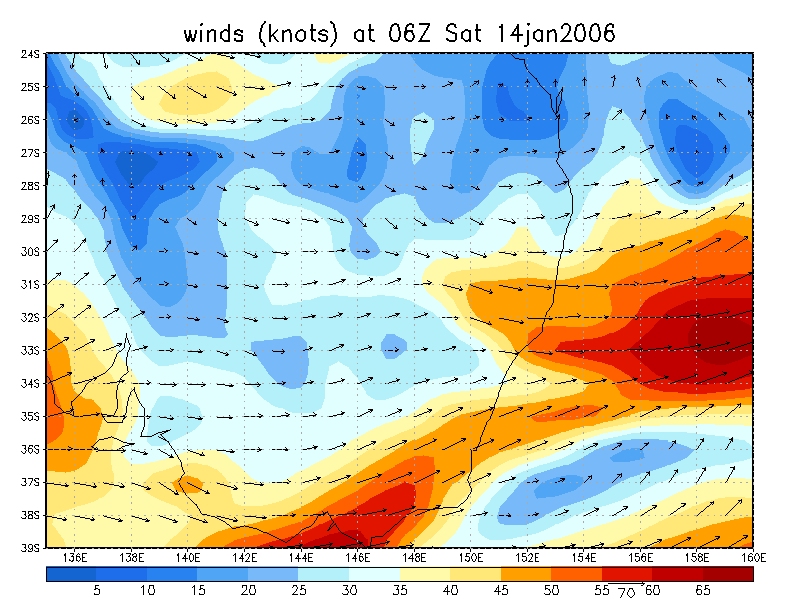
From NOAA 14/01/2006 06z analysis
|
Document: 200601-06.htm Updated: 9th February 2006 |
[Australian Severe Weather index] [Copyright Notice] [Email Contacts] [Search This Site] |