and Chasing
[Index][Archives]
Severe Storm in the Lismore to Woodburn area: Thursday 23rd December 2004
by Michael Bath, Dave Ellem and Rodney Wallbridge
| Storm News and Chasing [Index][Archives] |
Severe Storm in the Lismore to Woodburn area: Thursday 23rd December 2004 by Michael Bath, Dave Ellem and Rodney Wallbridge |
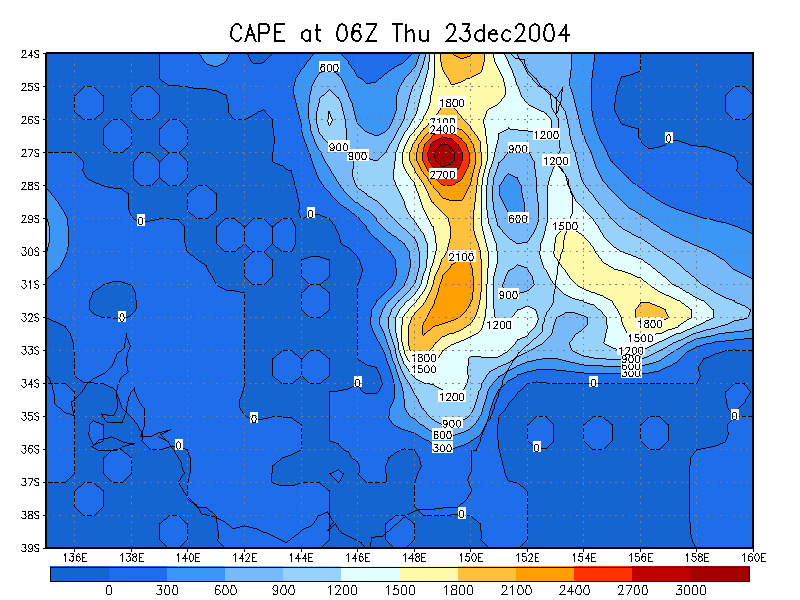
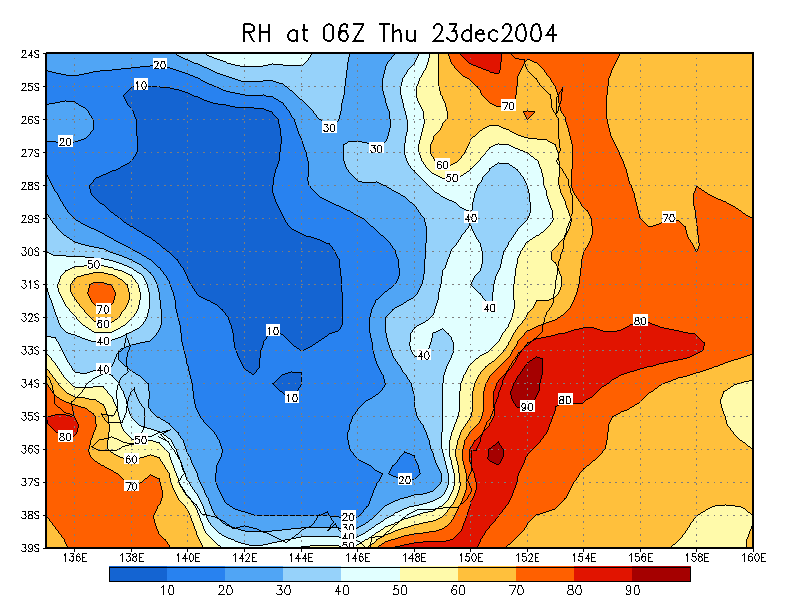
Dave Ellem wanted a nice storm for his 21st birthday. The setup was pretty good with great turning of winds with height: 15kt NNE at surface, 15kt N @ 925, 12kt NW @ 850, 20kt W at 700, 20kt SW at 600 and 500, and 50kt SW at 300. Moisture was ok and instability good.
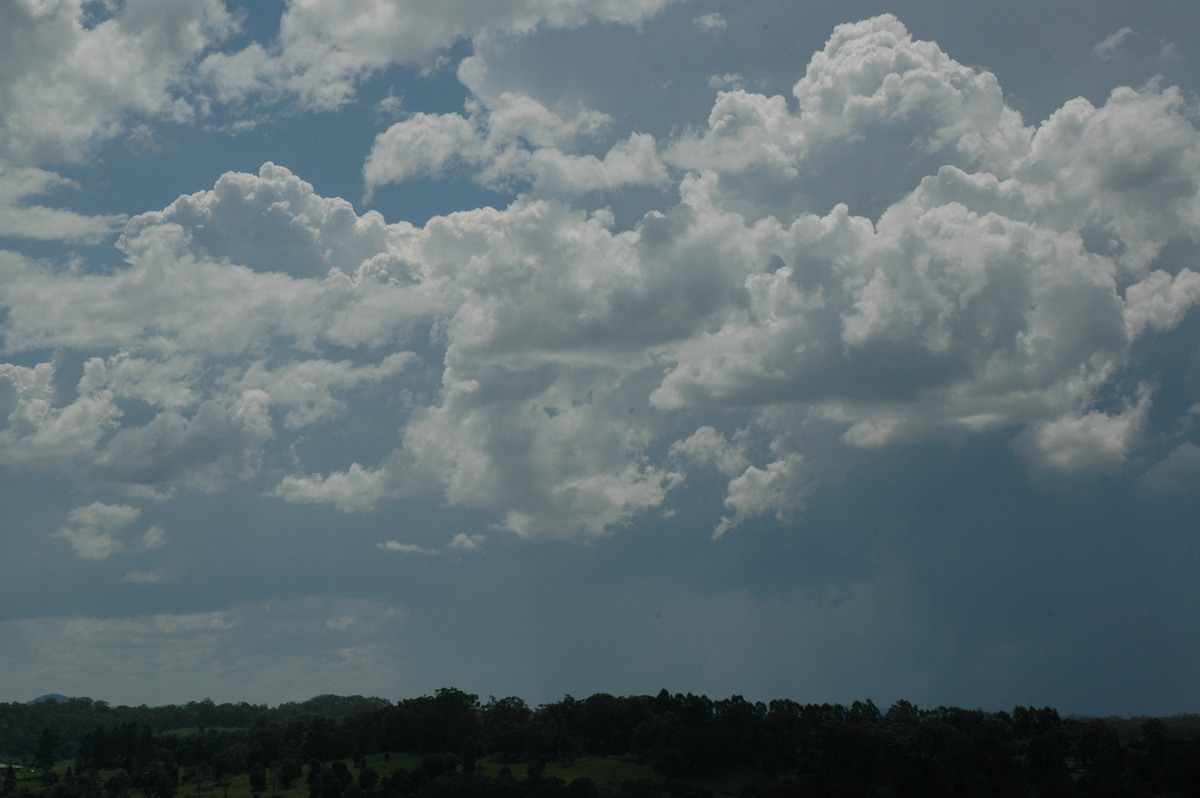
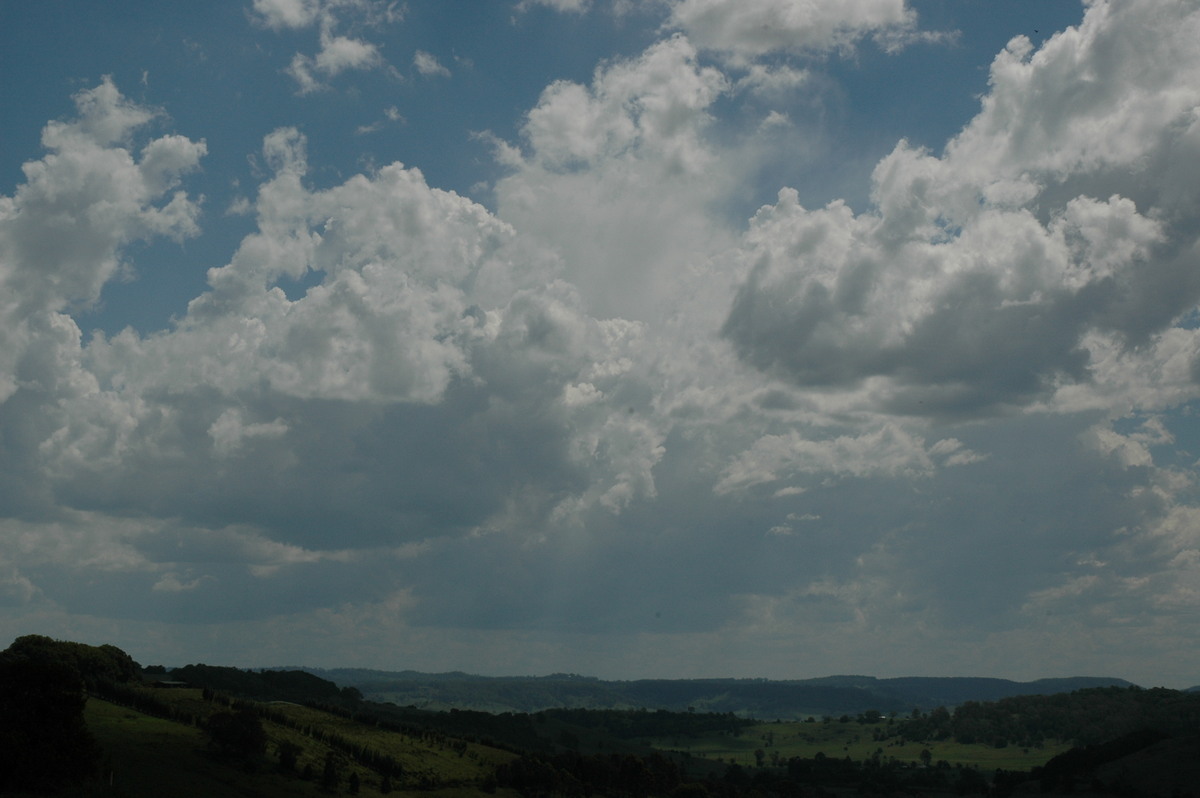
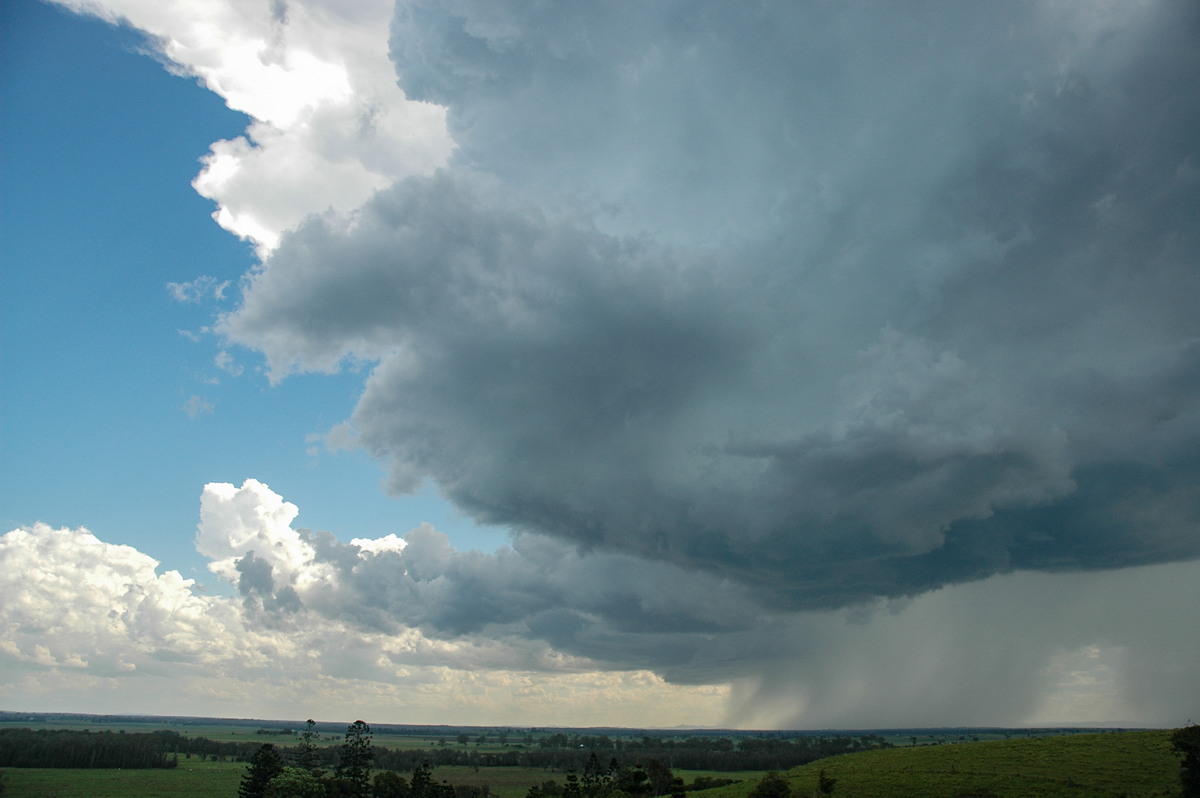
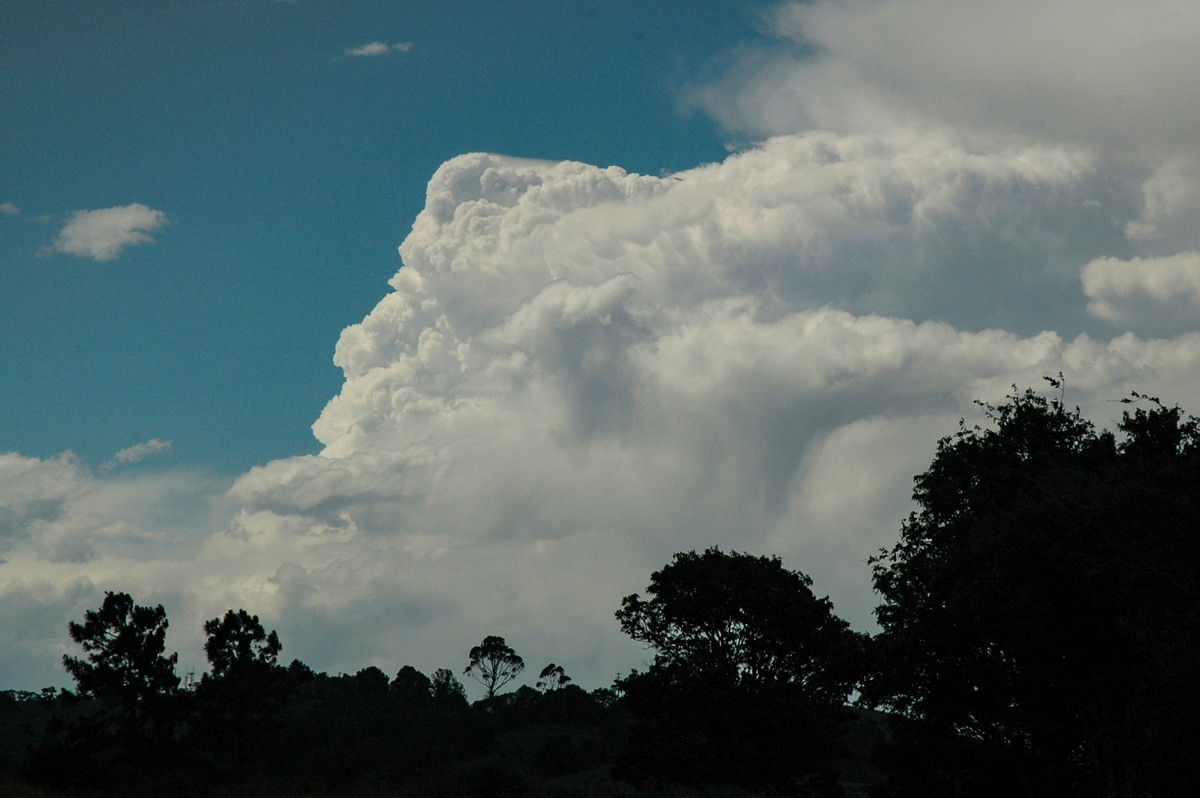
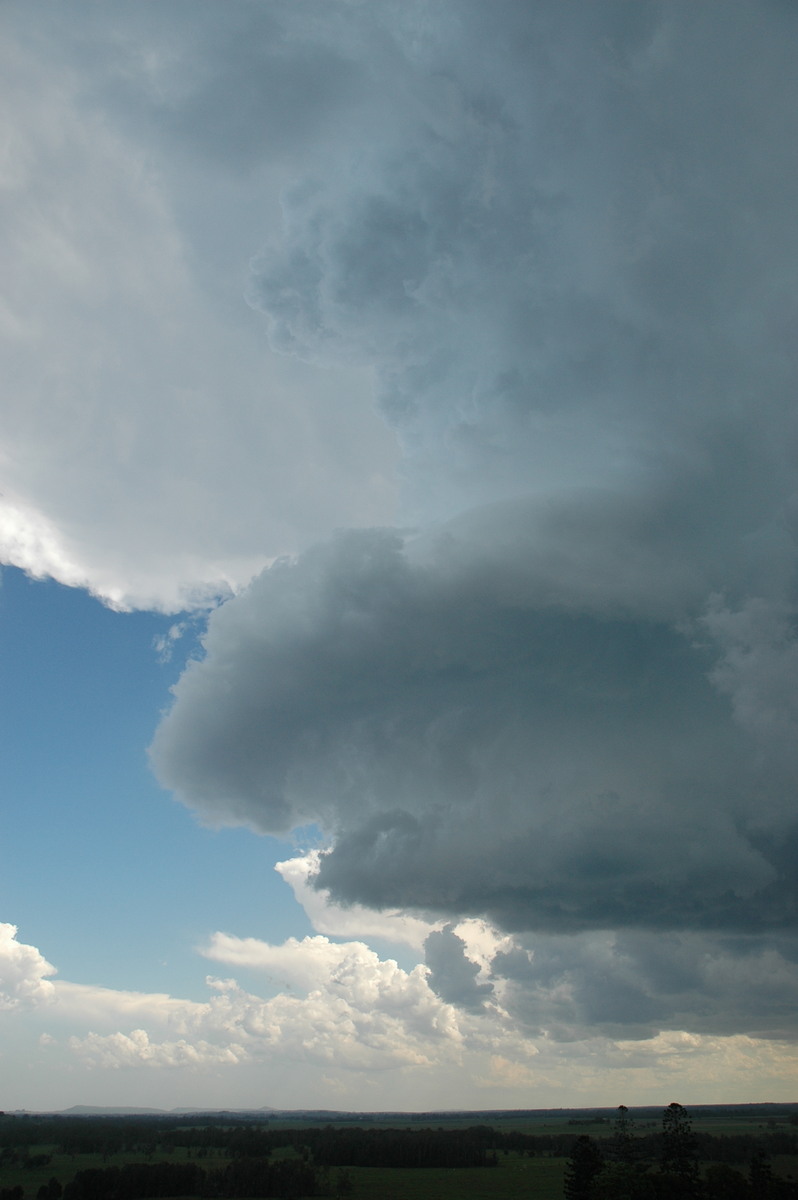
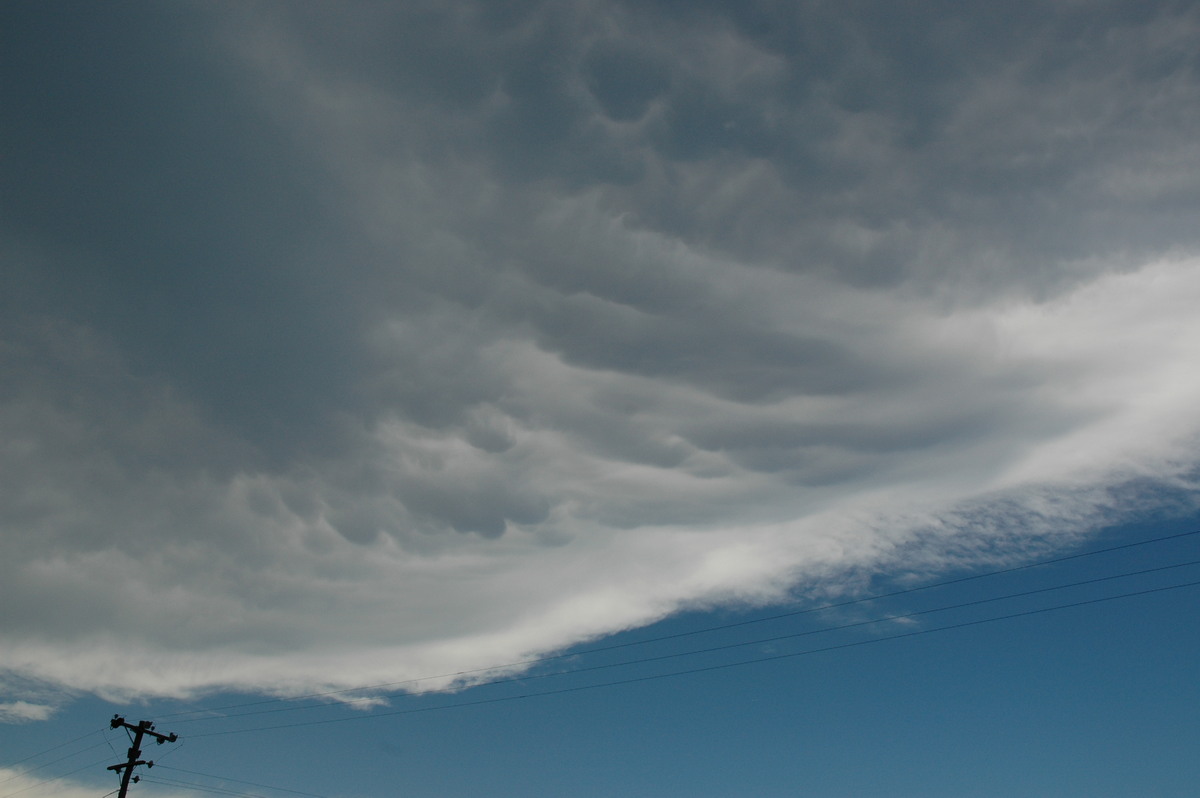
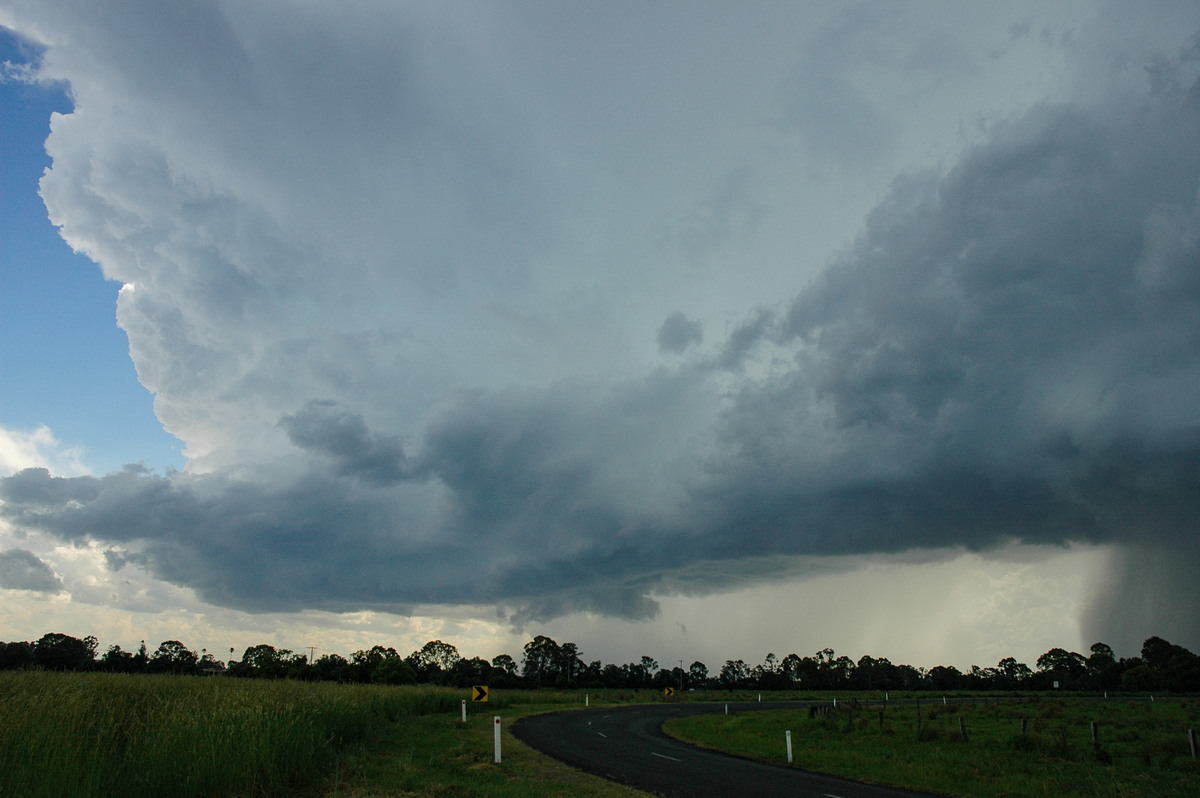
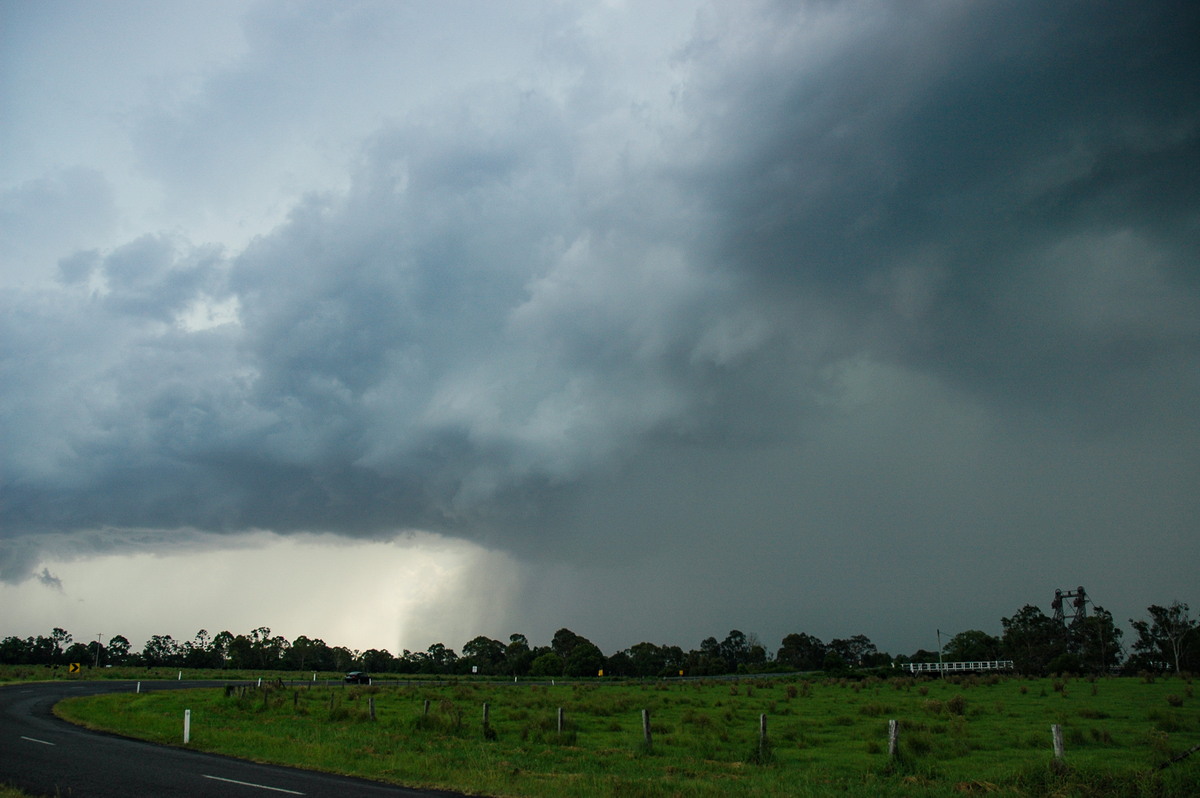
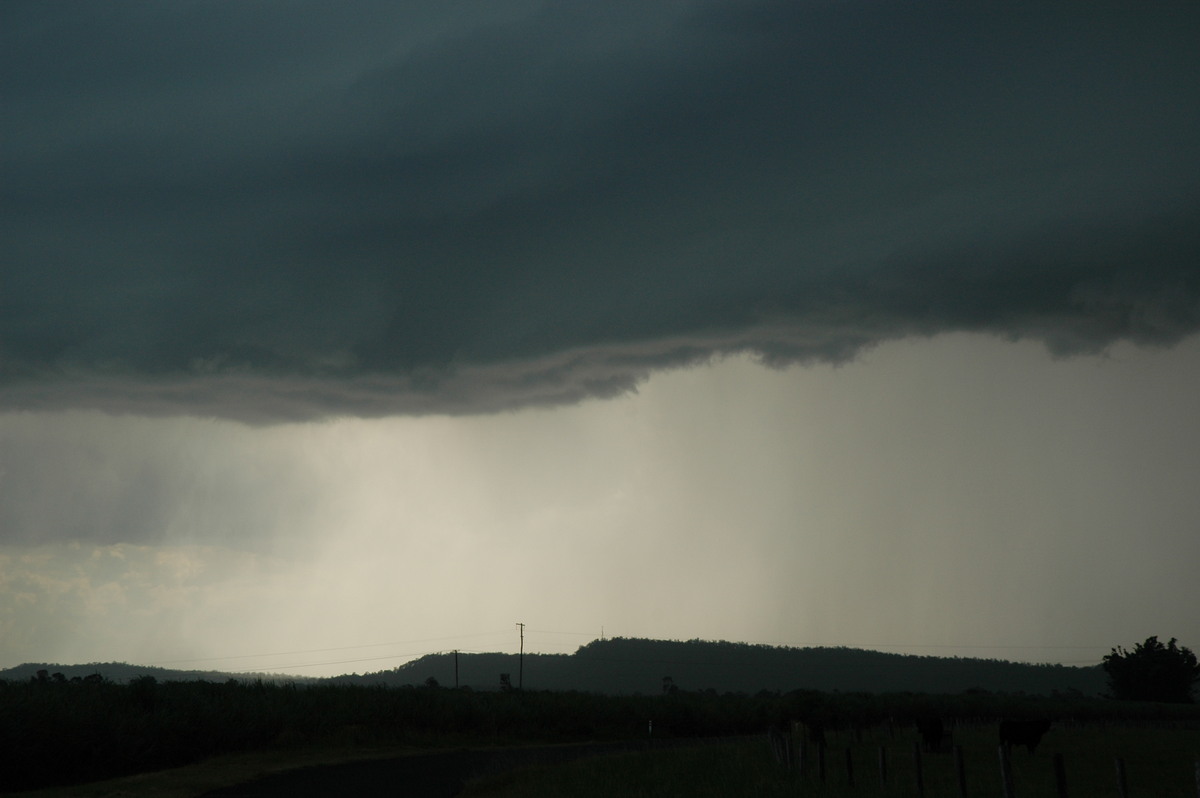
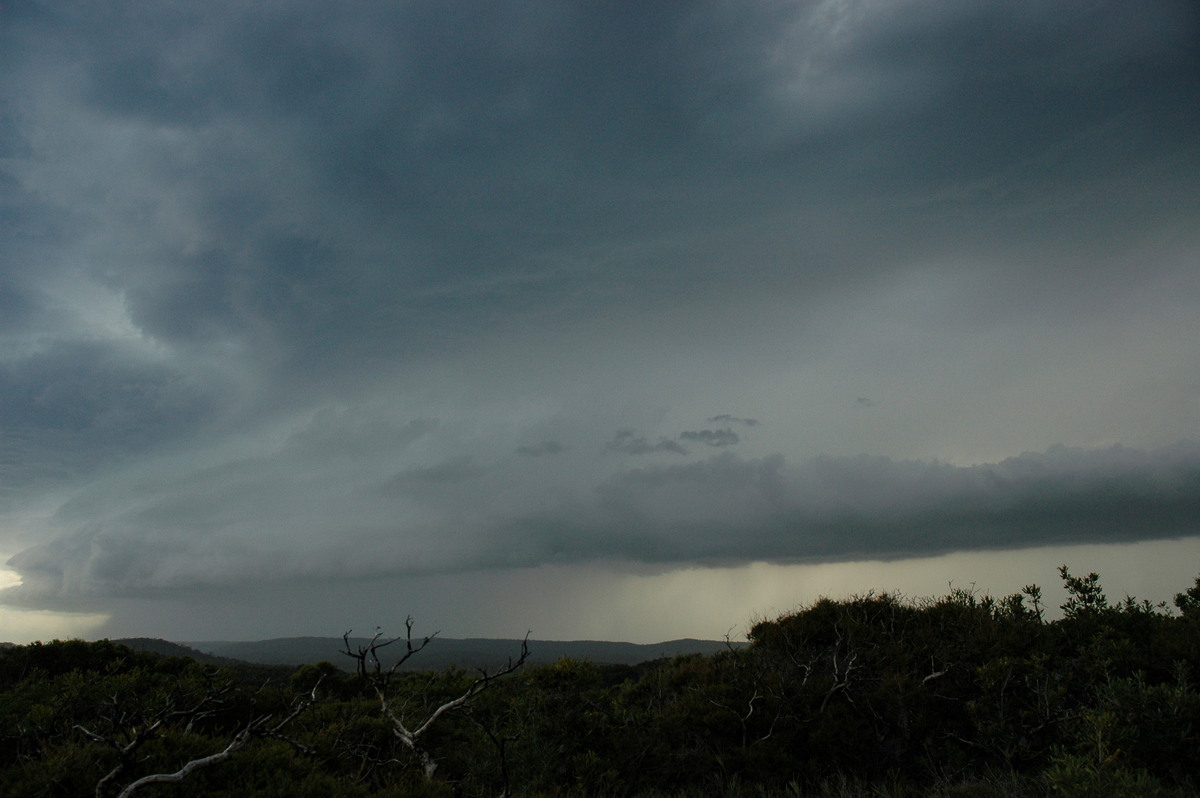
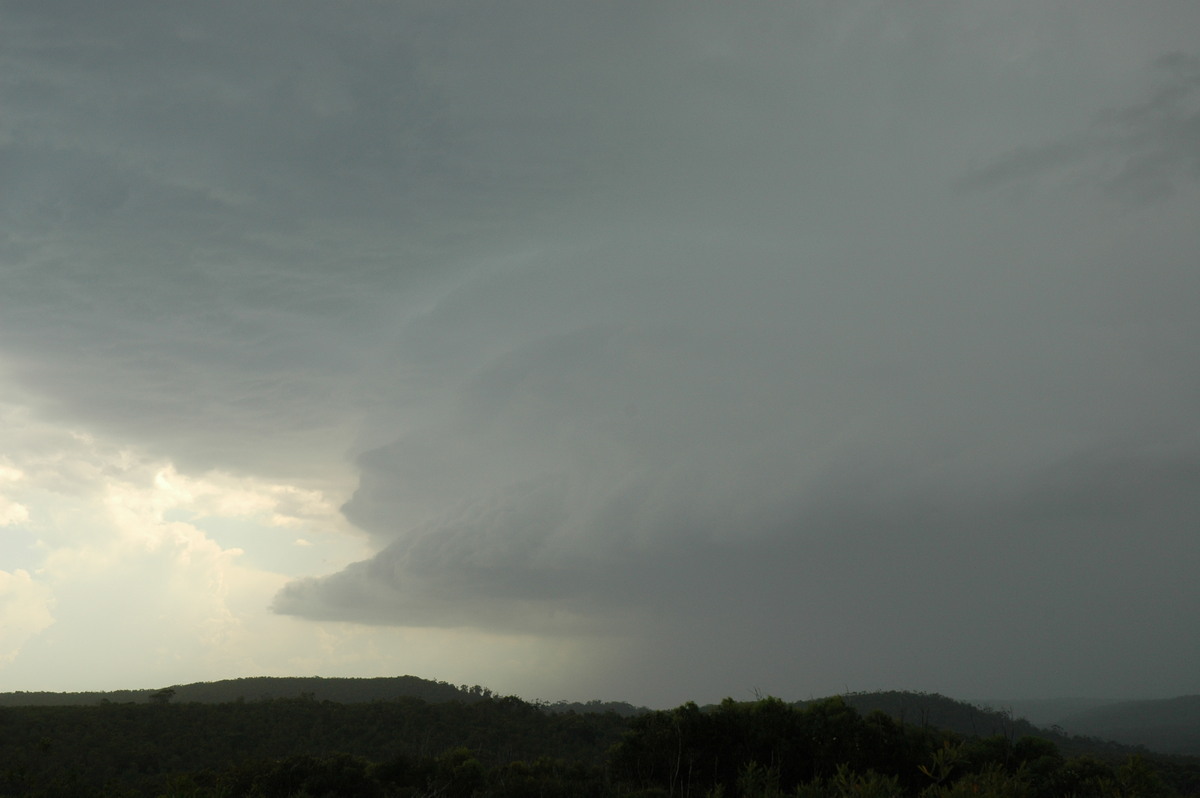
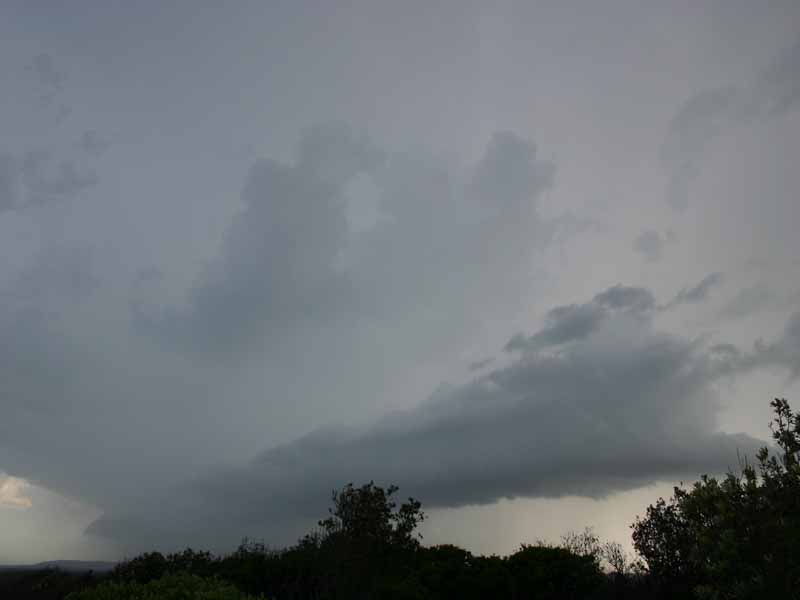
Strom activity kicked off NW of Kyogle about 1pm. The following photos were taken from McLeans Ridges before heading out.
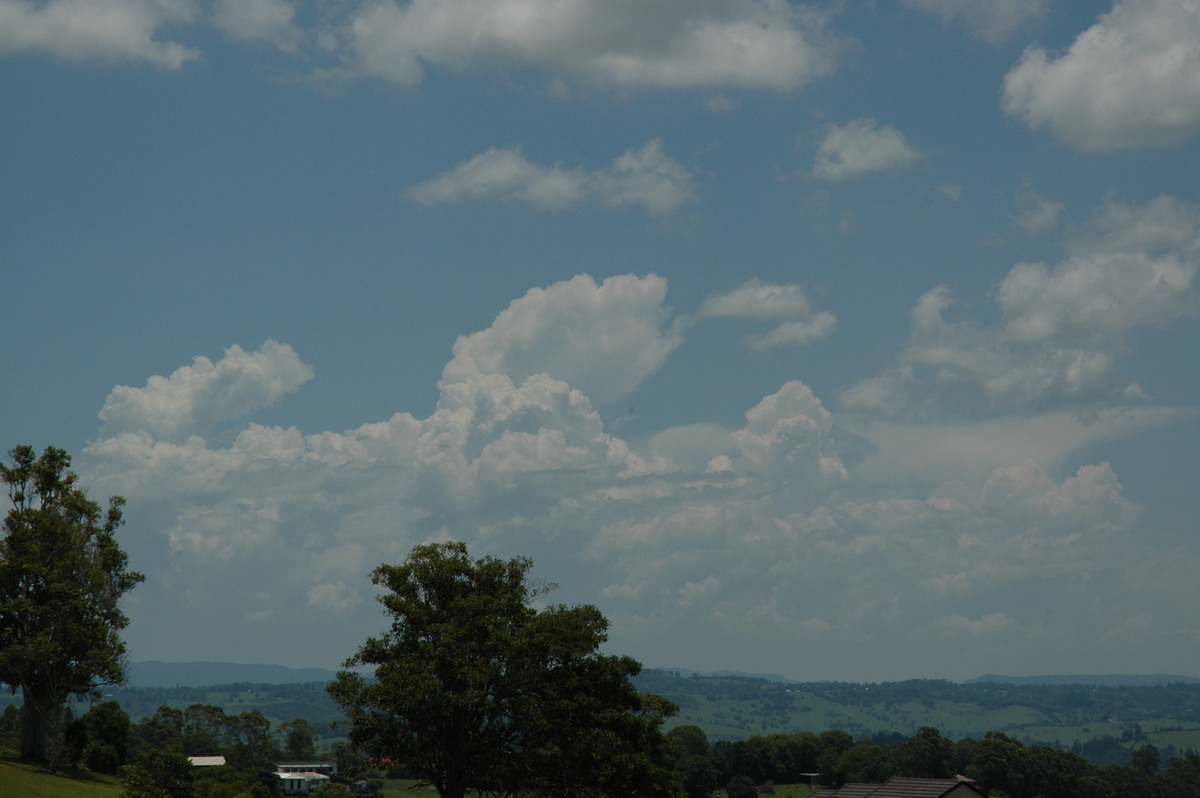
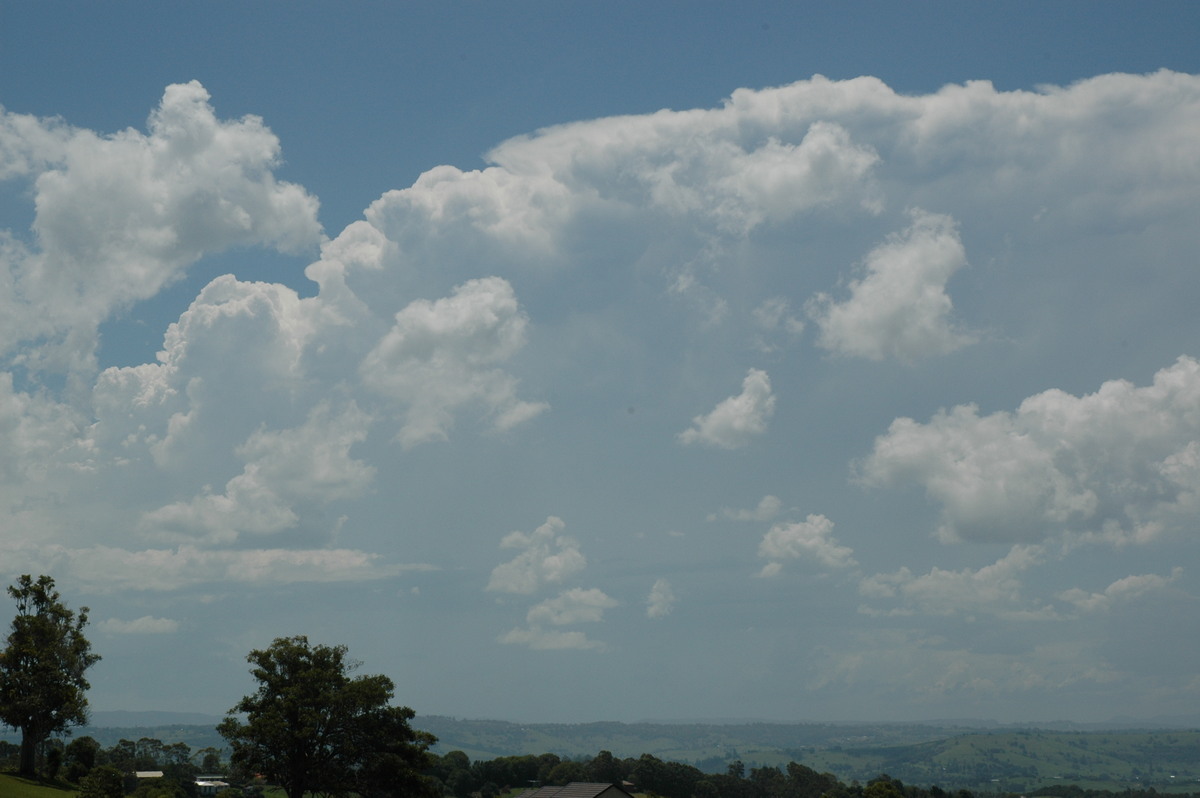
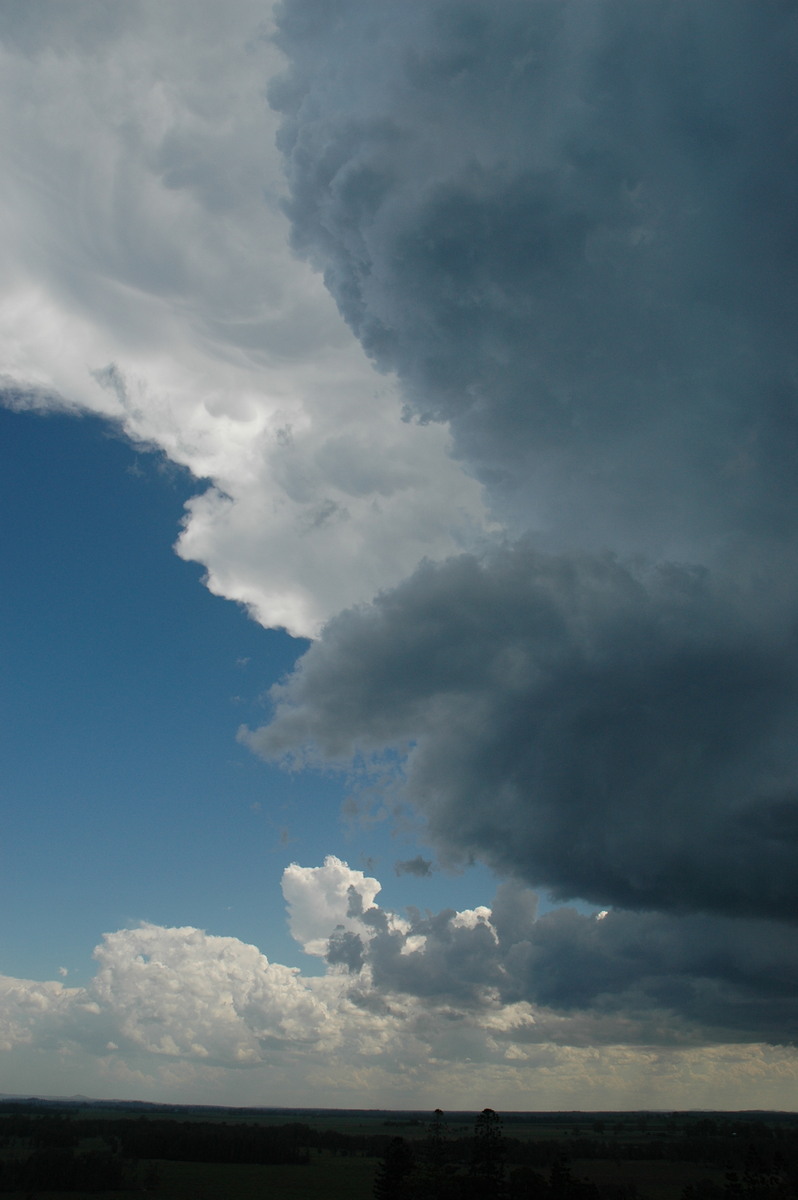
Just as Dave and I decided to head out, Scott Hills called in to say he was near Casino looking at the northern activity. He indicated the updrafts were looking very strong. We met up with Rodney Wallbridge north Lismore about 2.30pm. The activity to the NW did not have much base structure from our position but the anvil was very thick and extensive. New updrafts continued to form on the SW flank and a line of congestus separate from the storm formed a line to the south, probably along the Richmond Range.
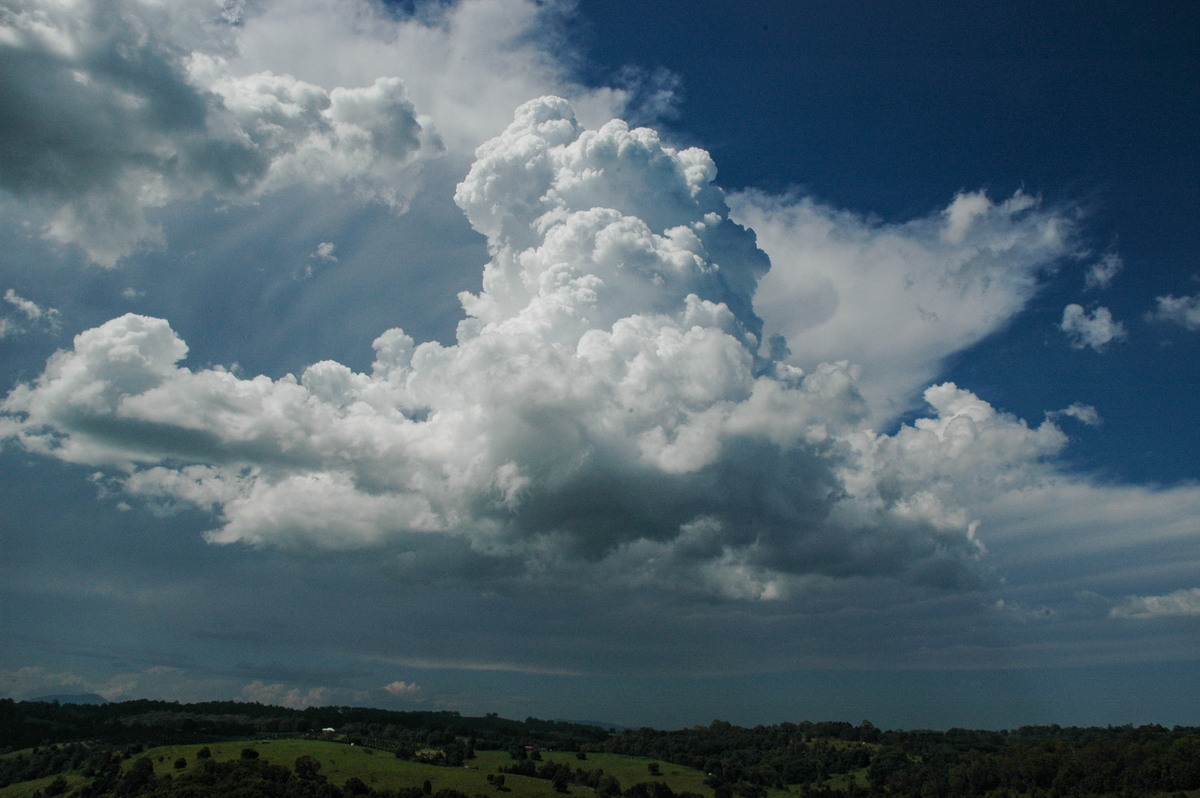
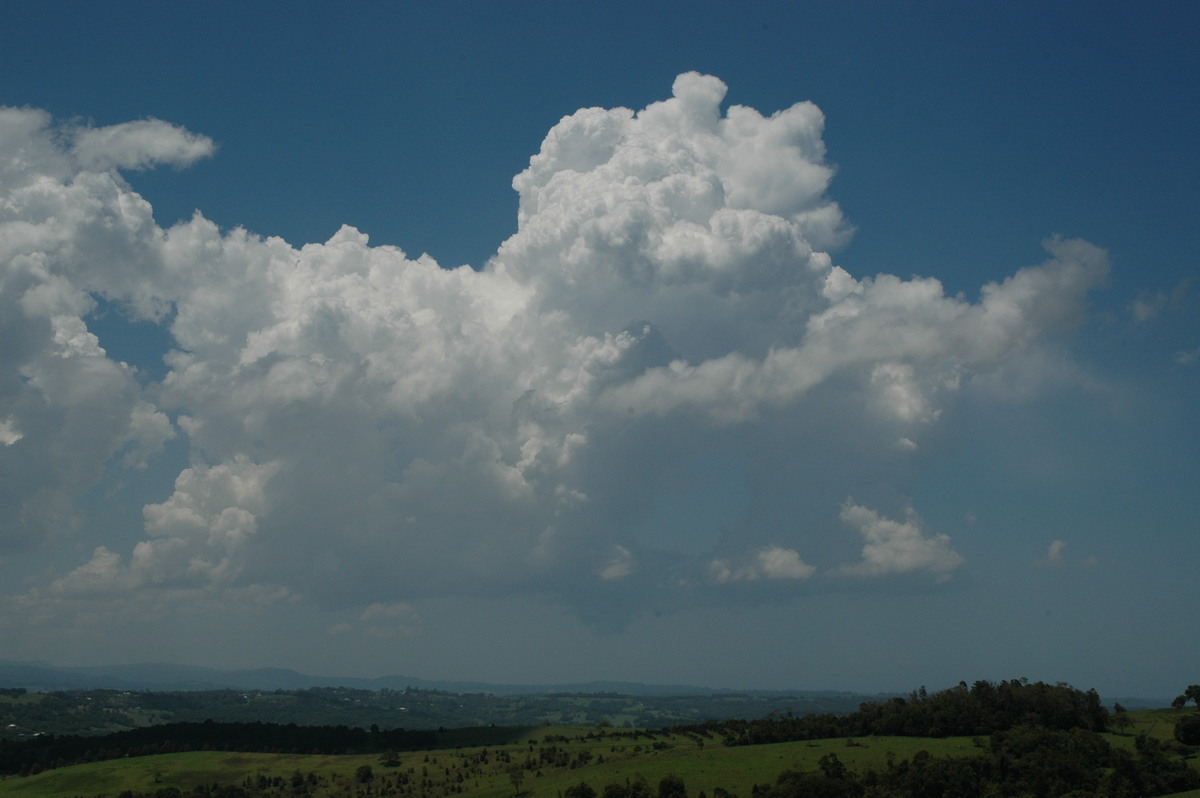
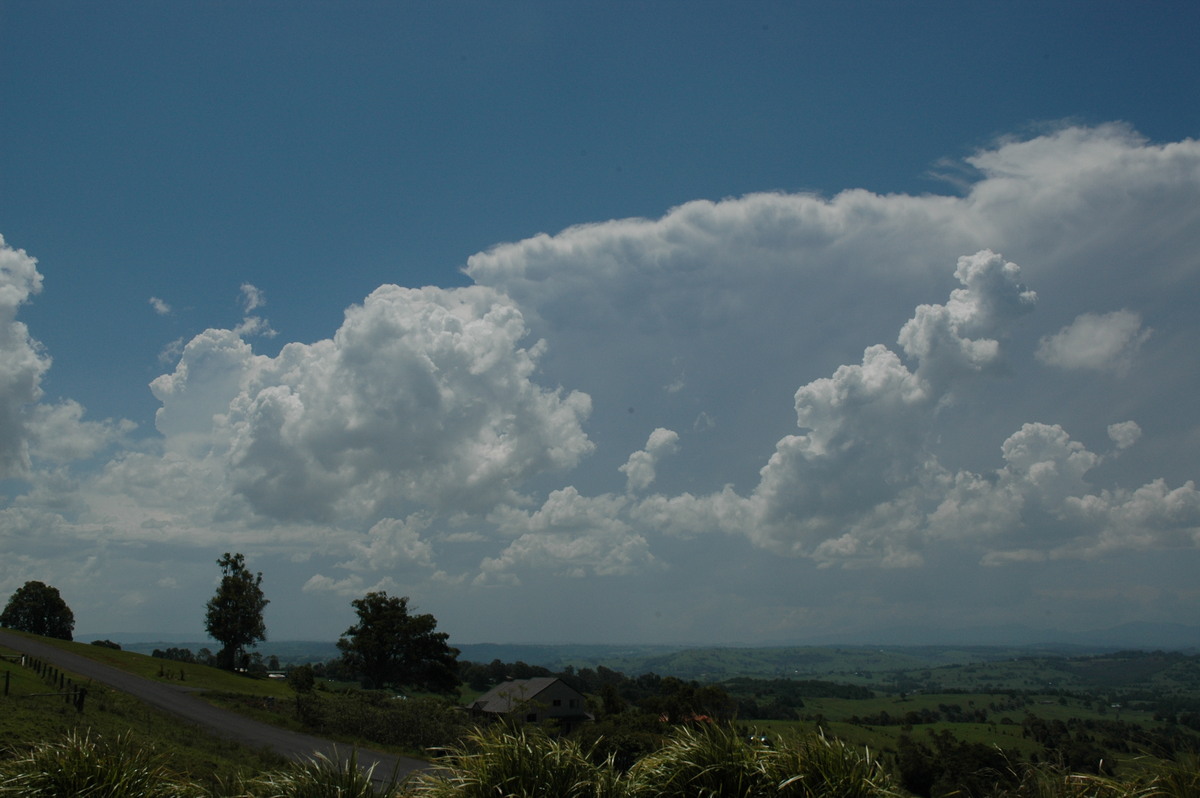
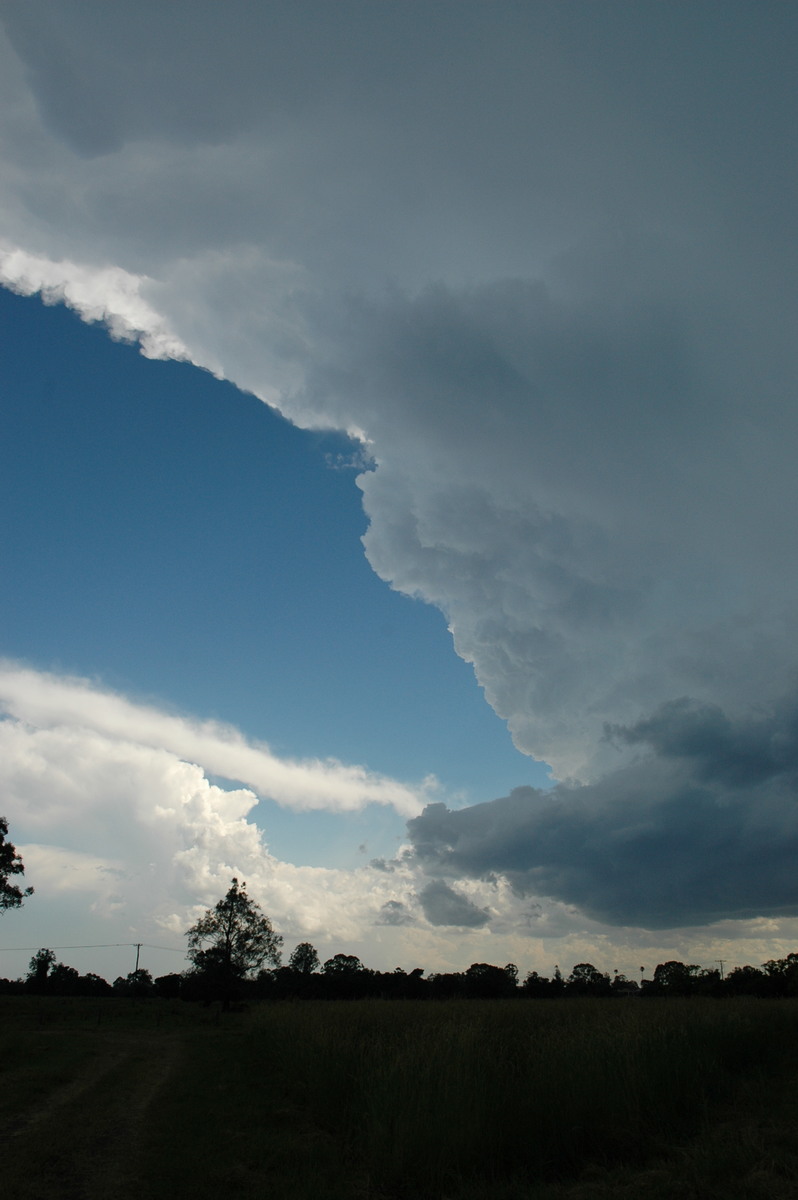
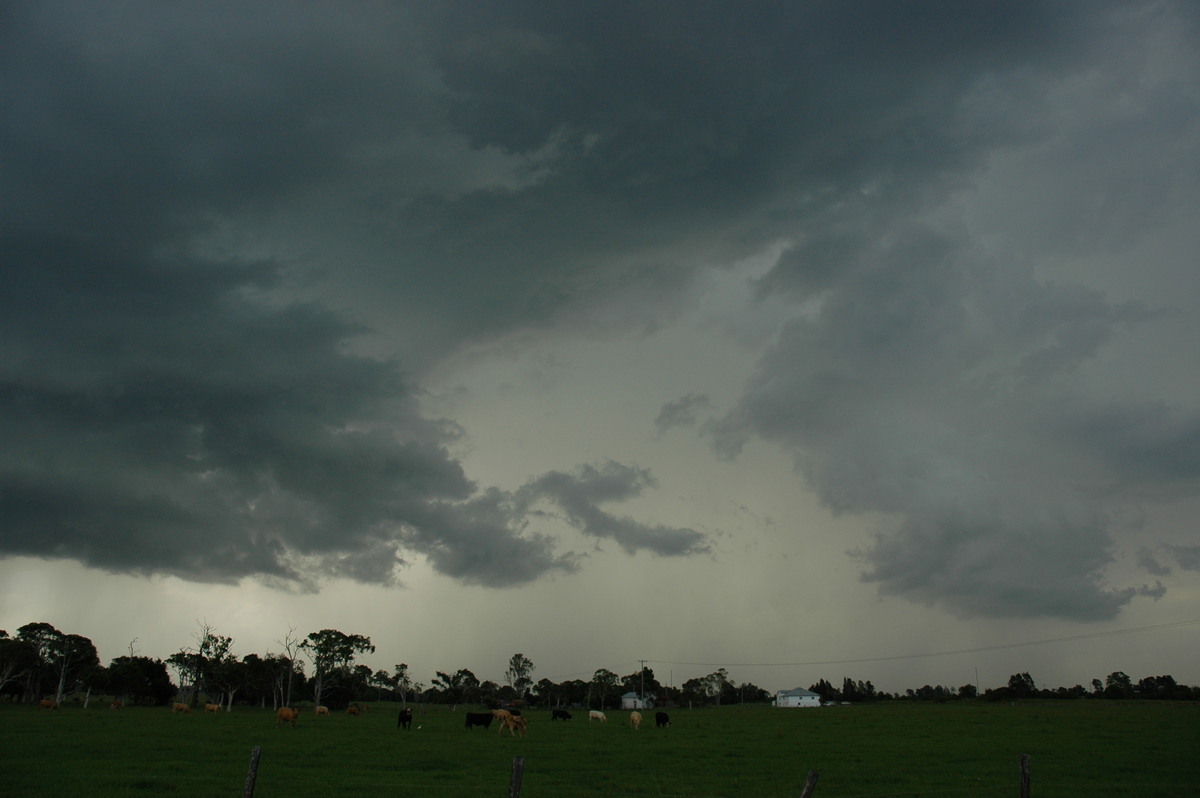
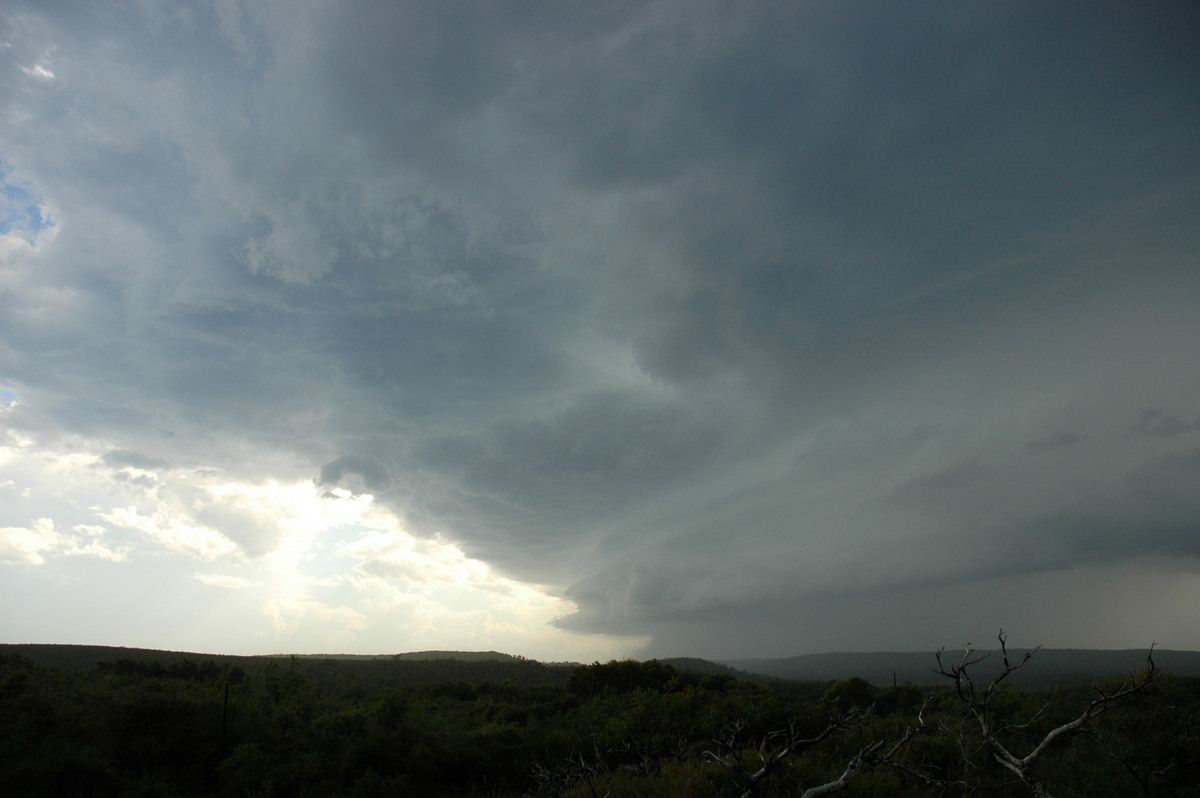
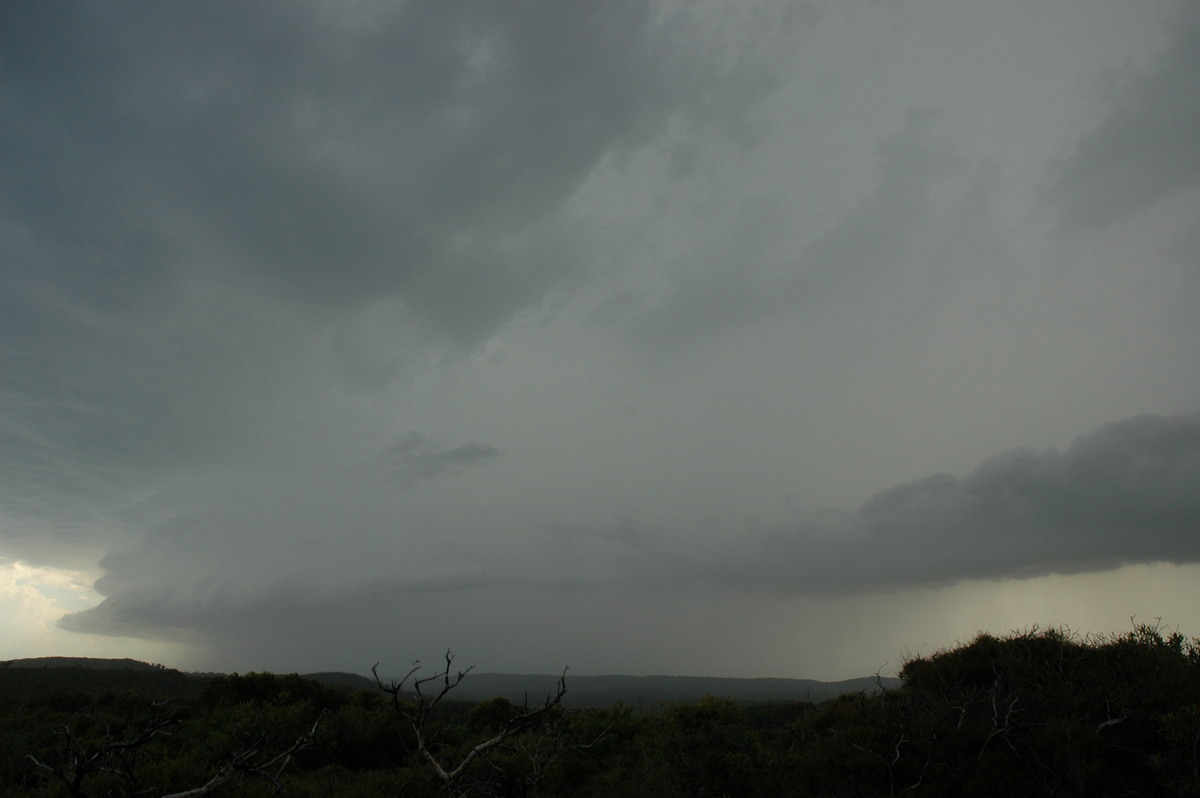
After about 30 mins at this location I thought a cell to our WSW was starting to organise. It was very weak, but base areas were growing and it looked to have the potential to take off.
We fuelled up at Lismore and in that short time the cell had really taken off. We quickly headed south as the updrafts were again on the southern side of the storm indicating it would move SE - something not expecting today given the shear setup.
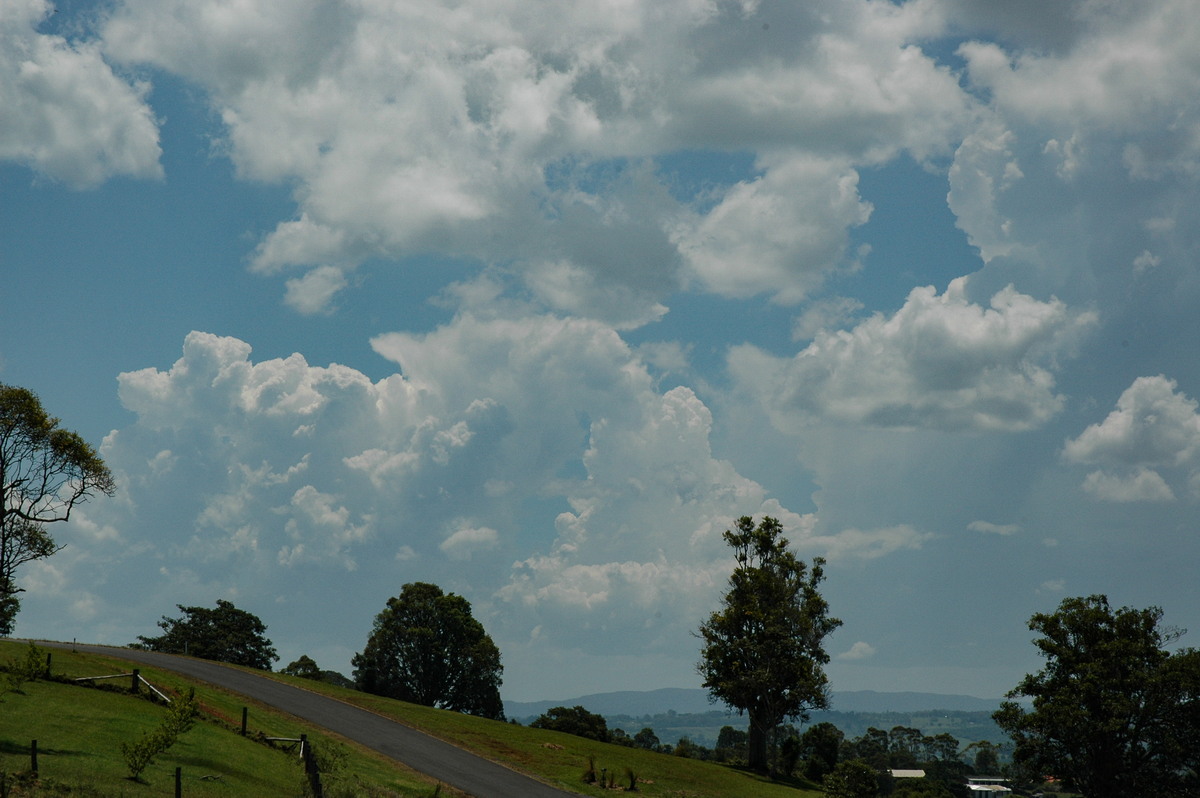
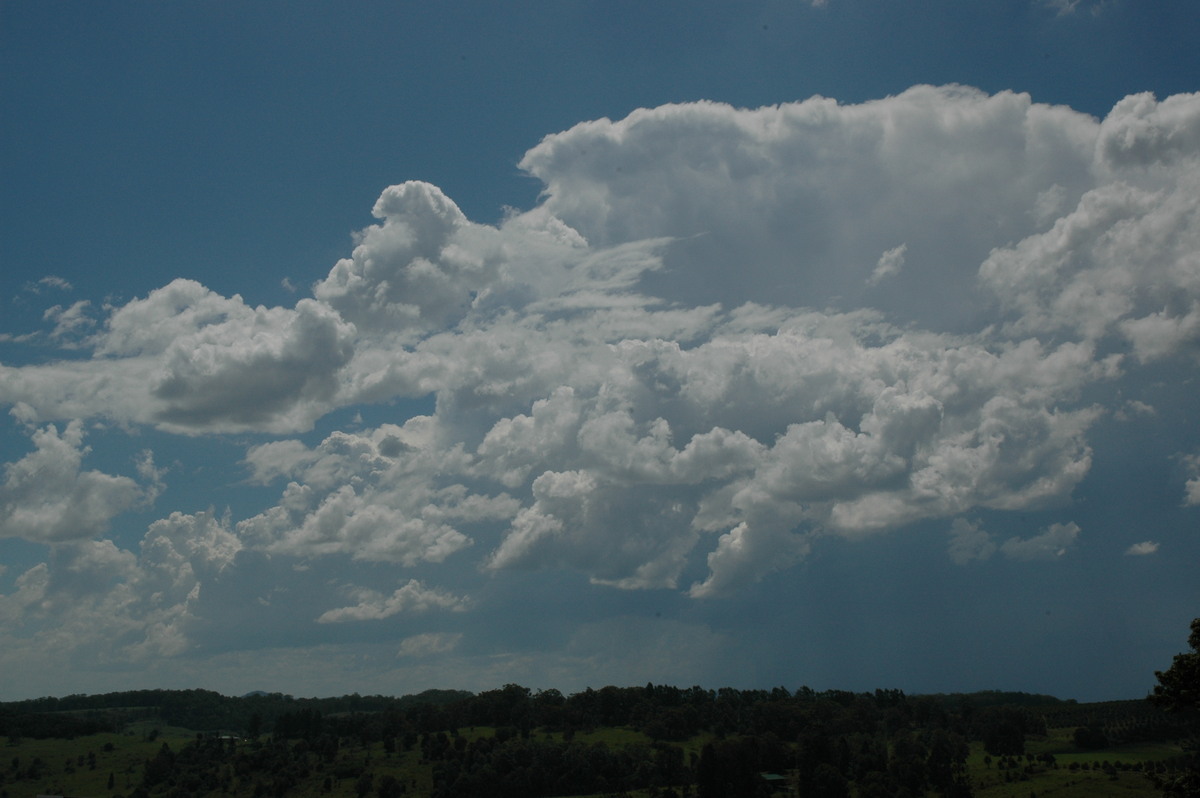
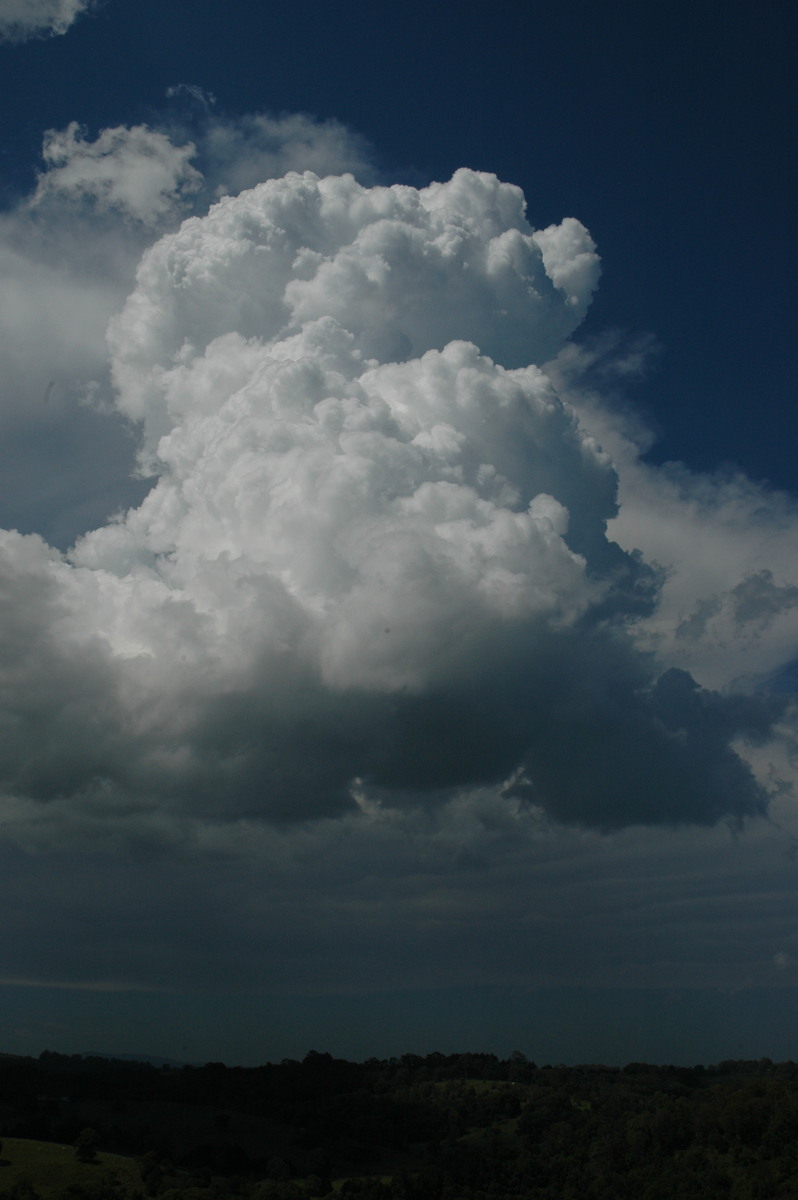
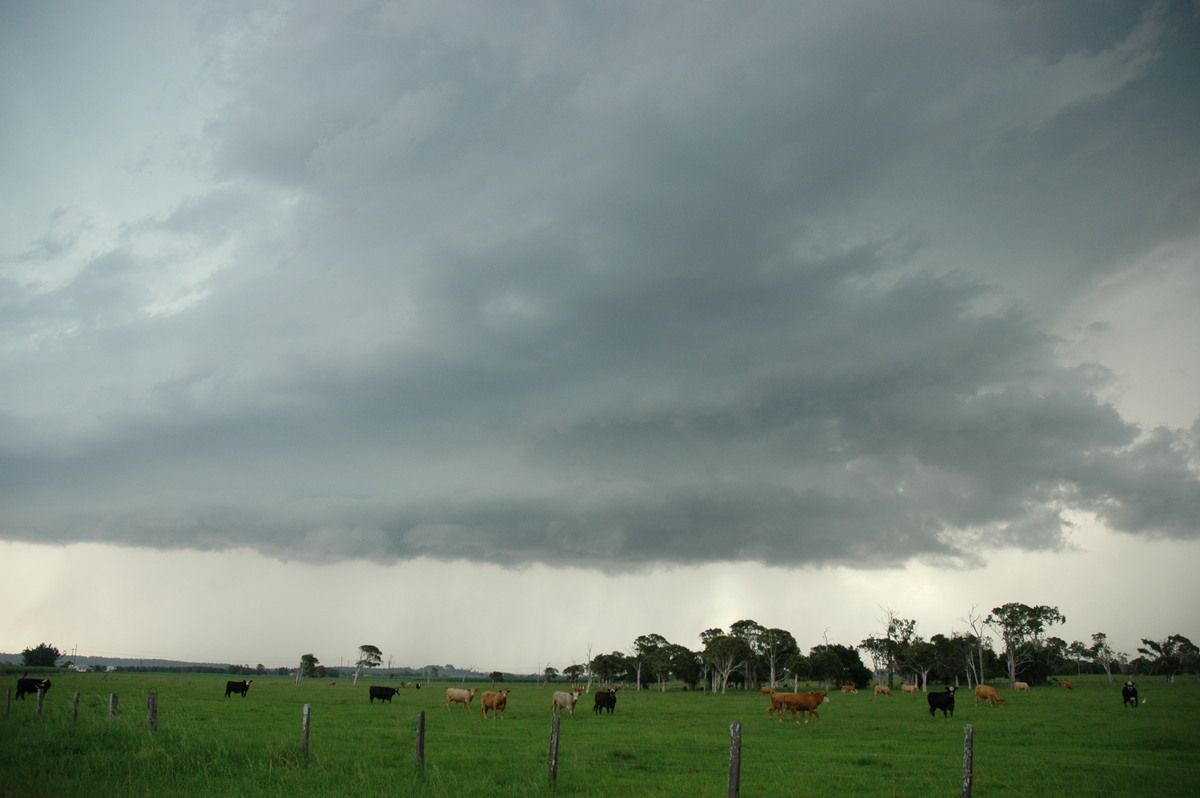
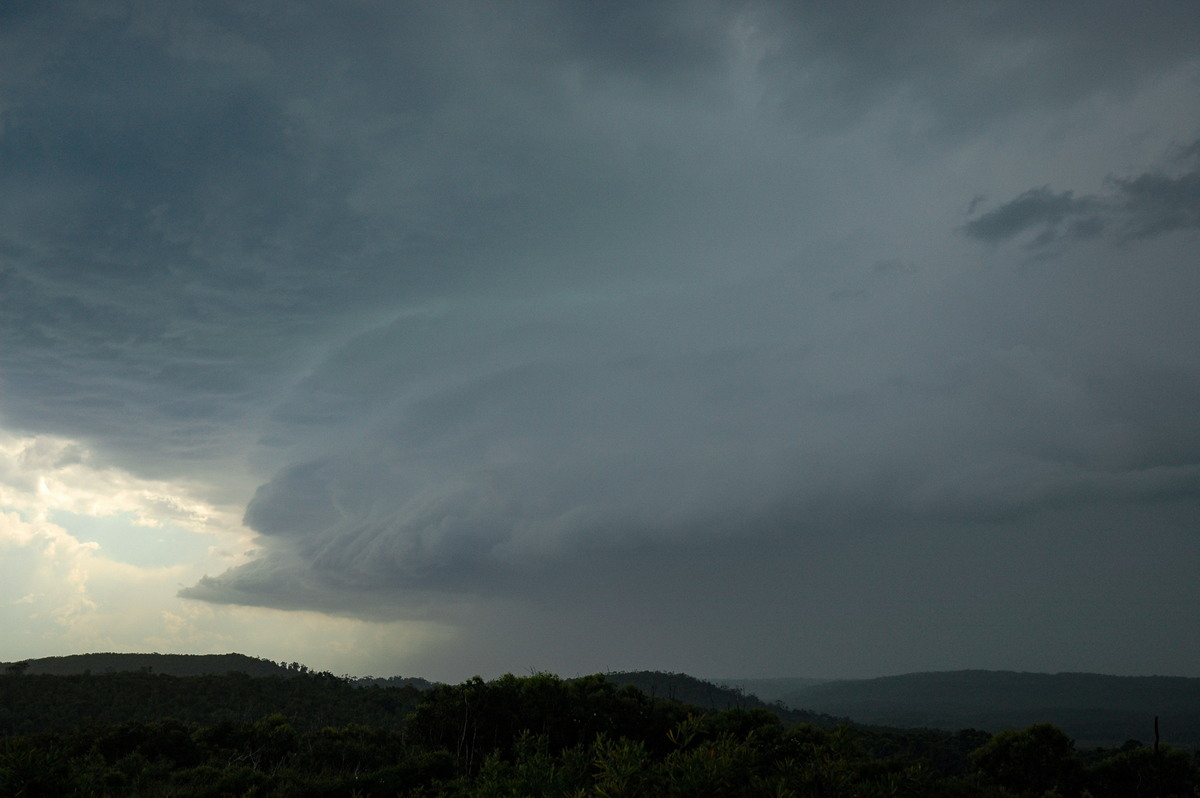
We stopped briefly near Lismore Airport for photos then got to Parrots Nest lookout for a better view. The NSW State Emergency Service called to gain our thoughts about whether the storm would become severe. We indicated yes and that it would head SE.
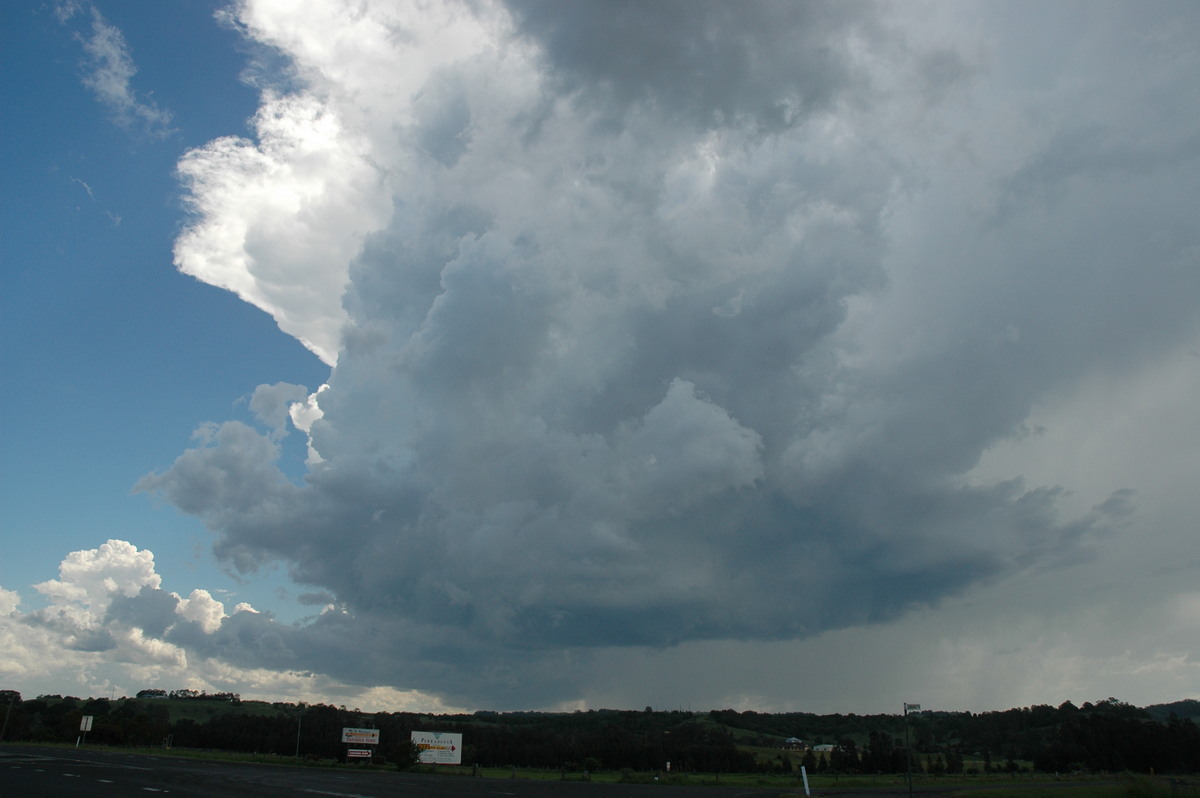
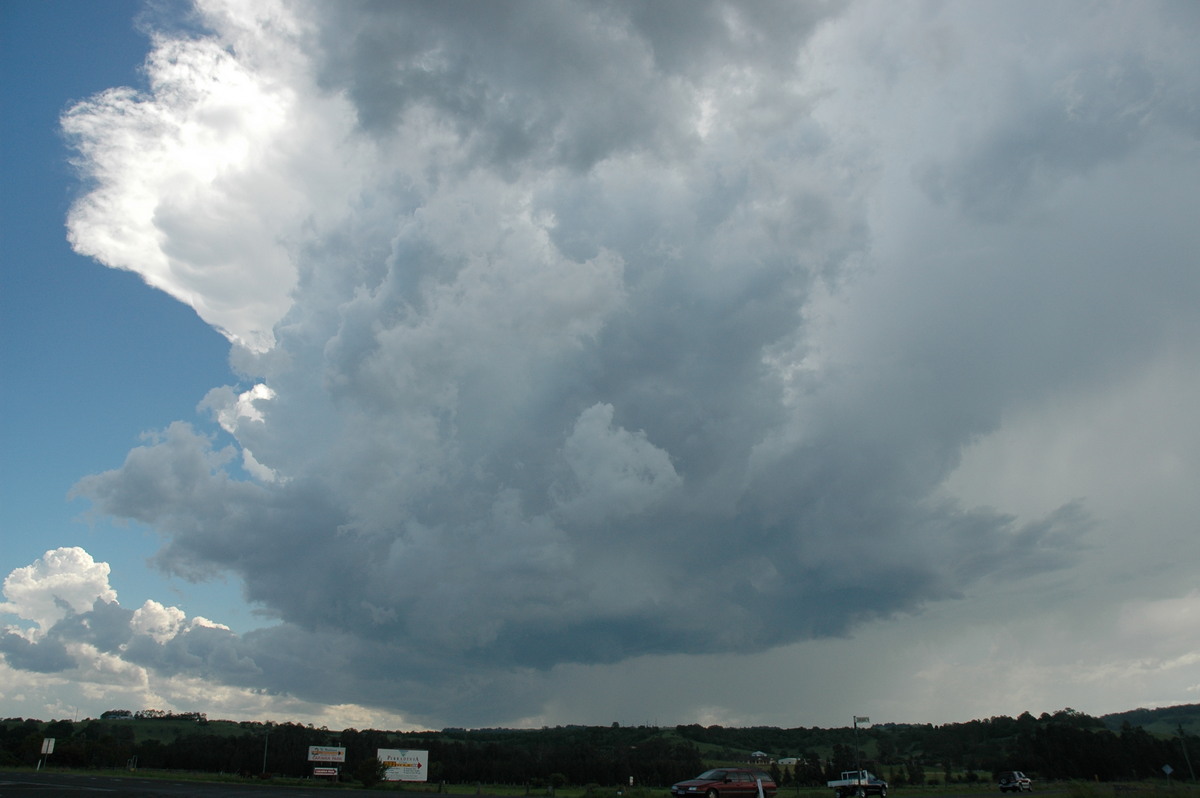
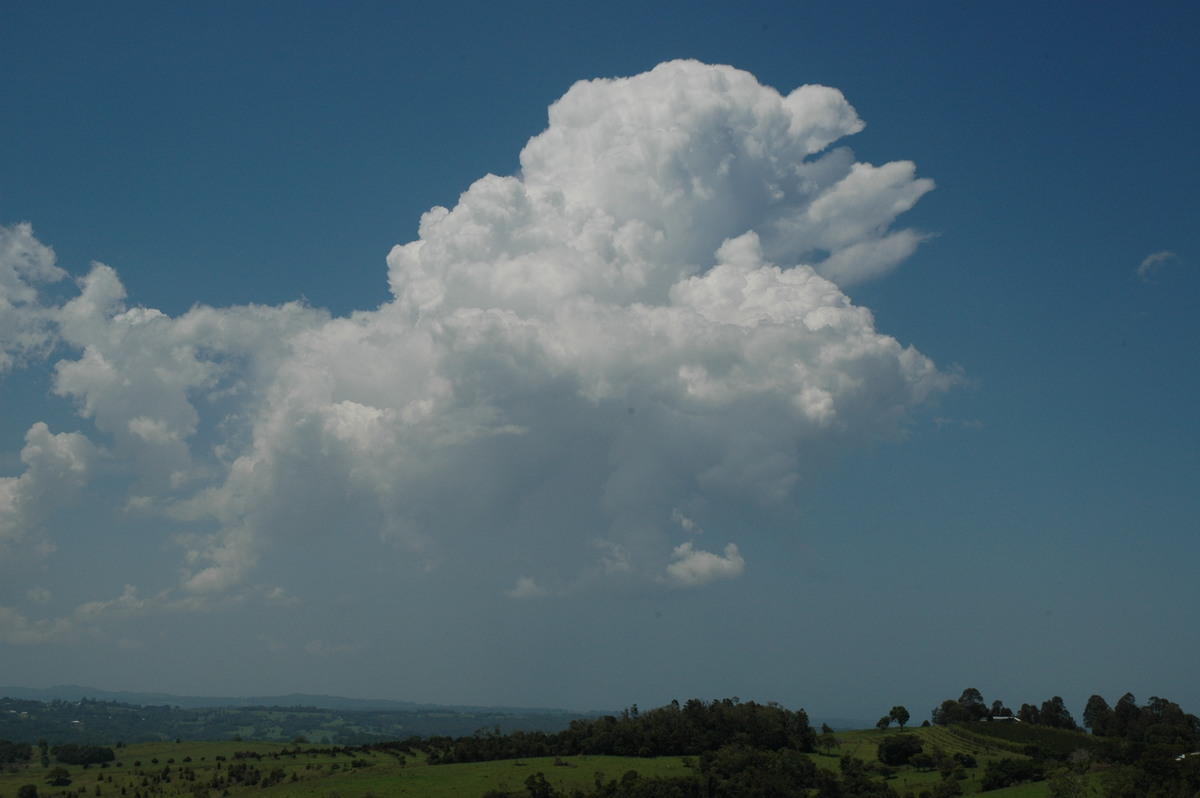
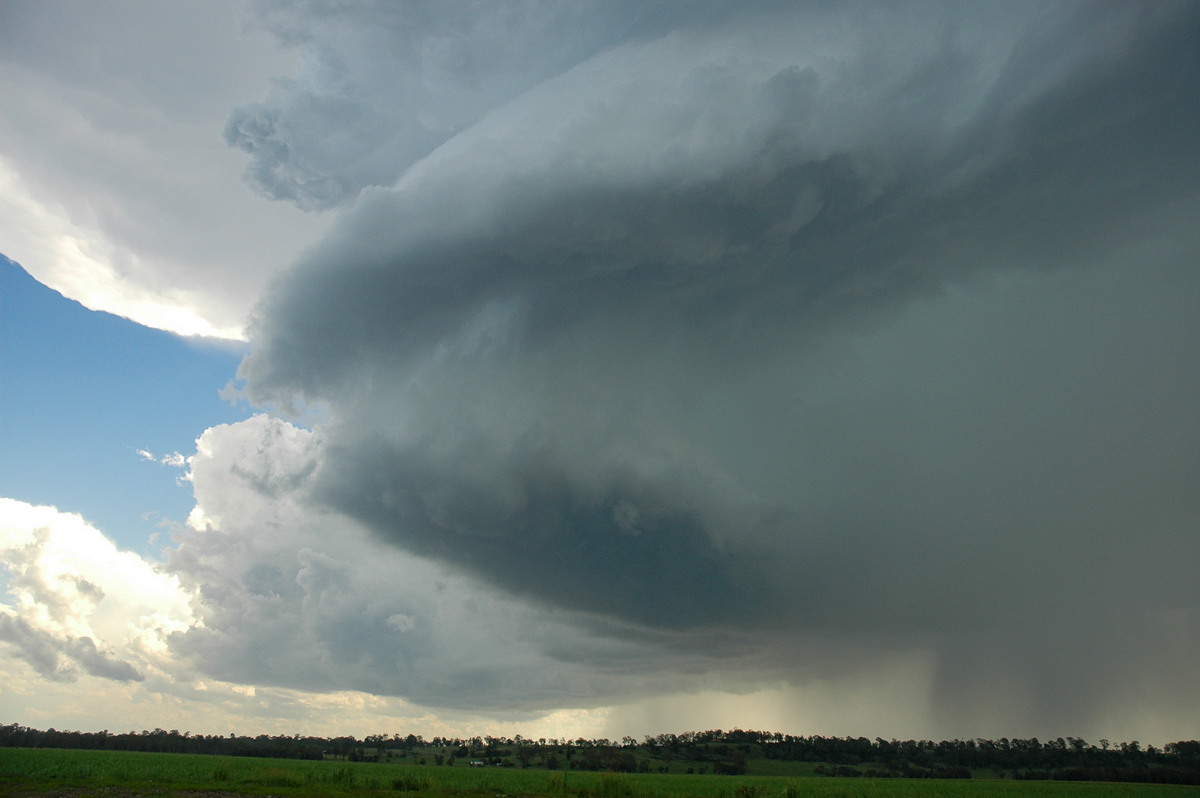
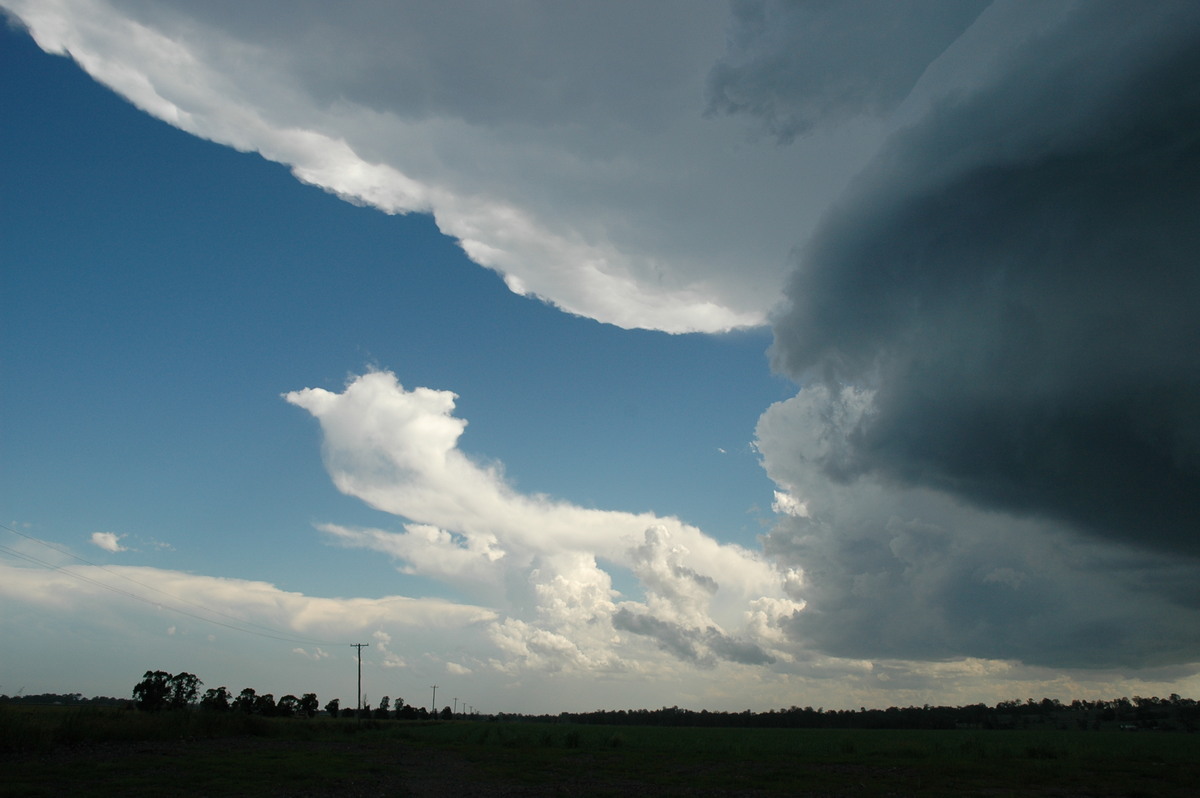
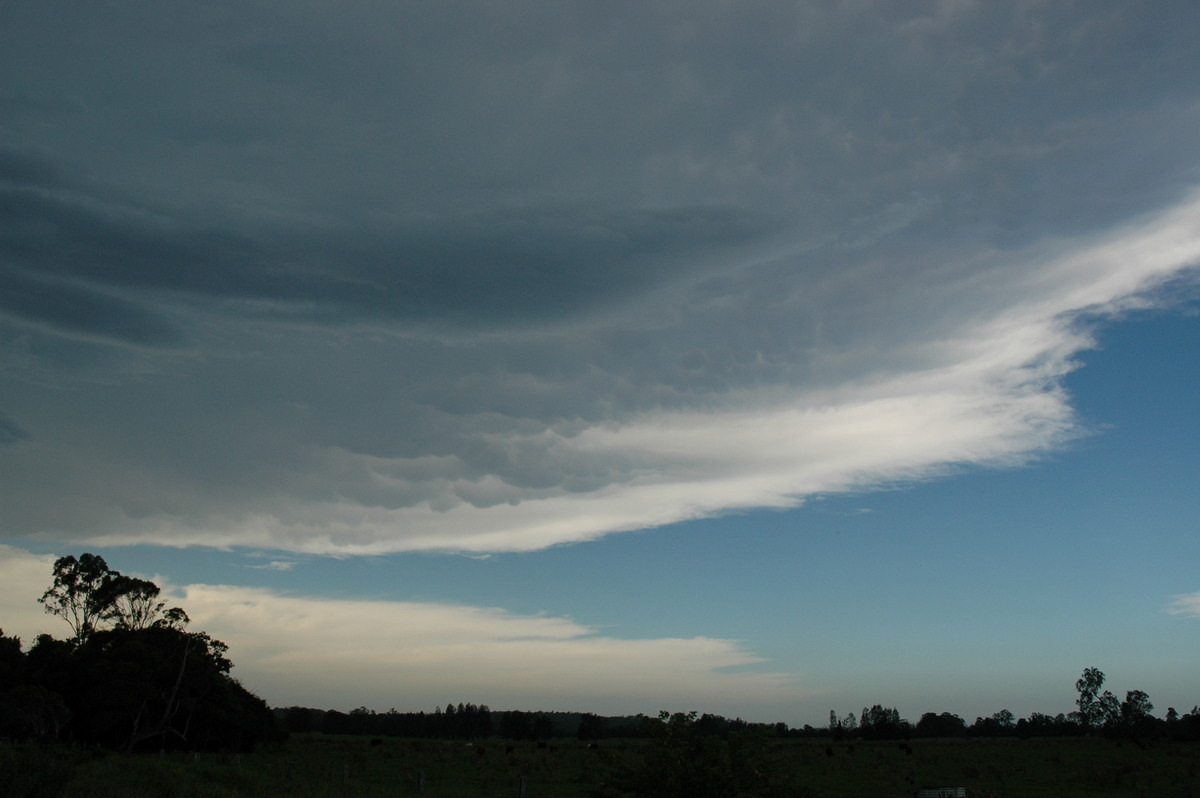
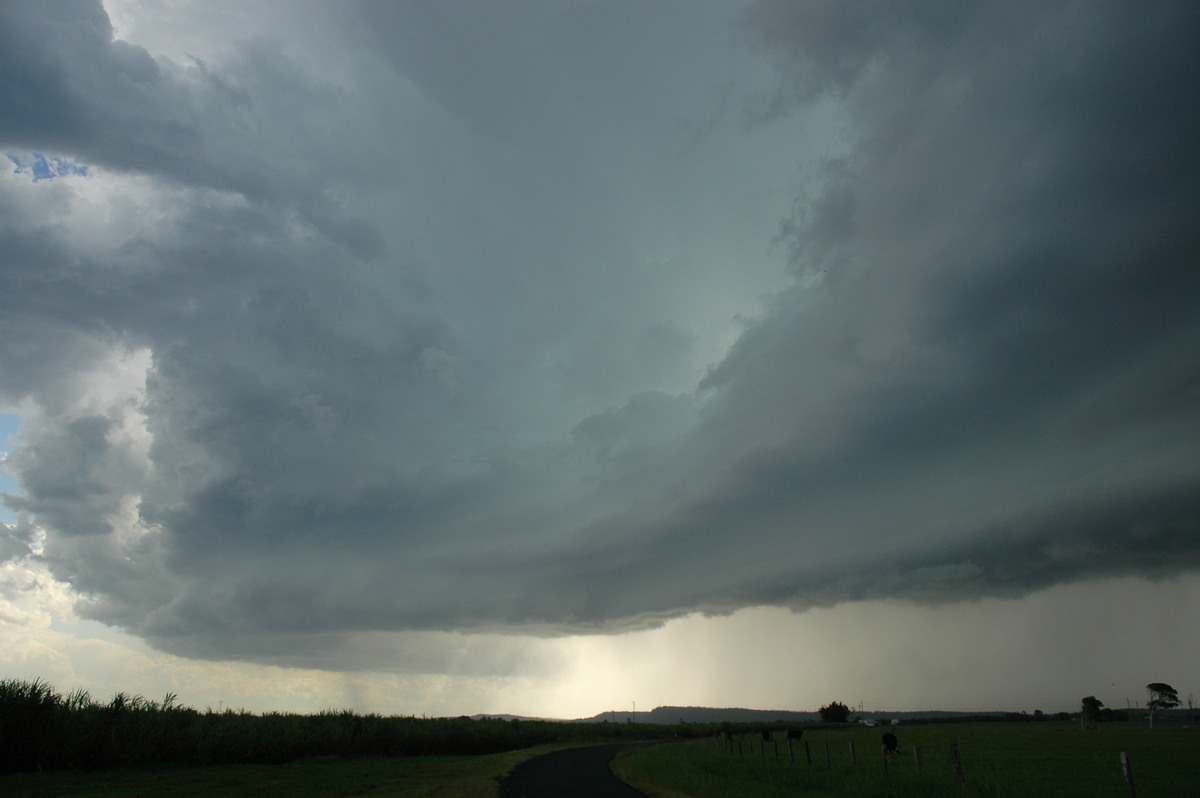
Heavy precipitation areas very quickly formed while powerful new updrafts developed on the S to SE edge. Lightning was quite close to us. A thick anvil started to curve out the top of the storm.
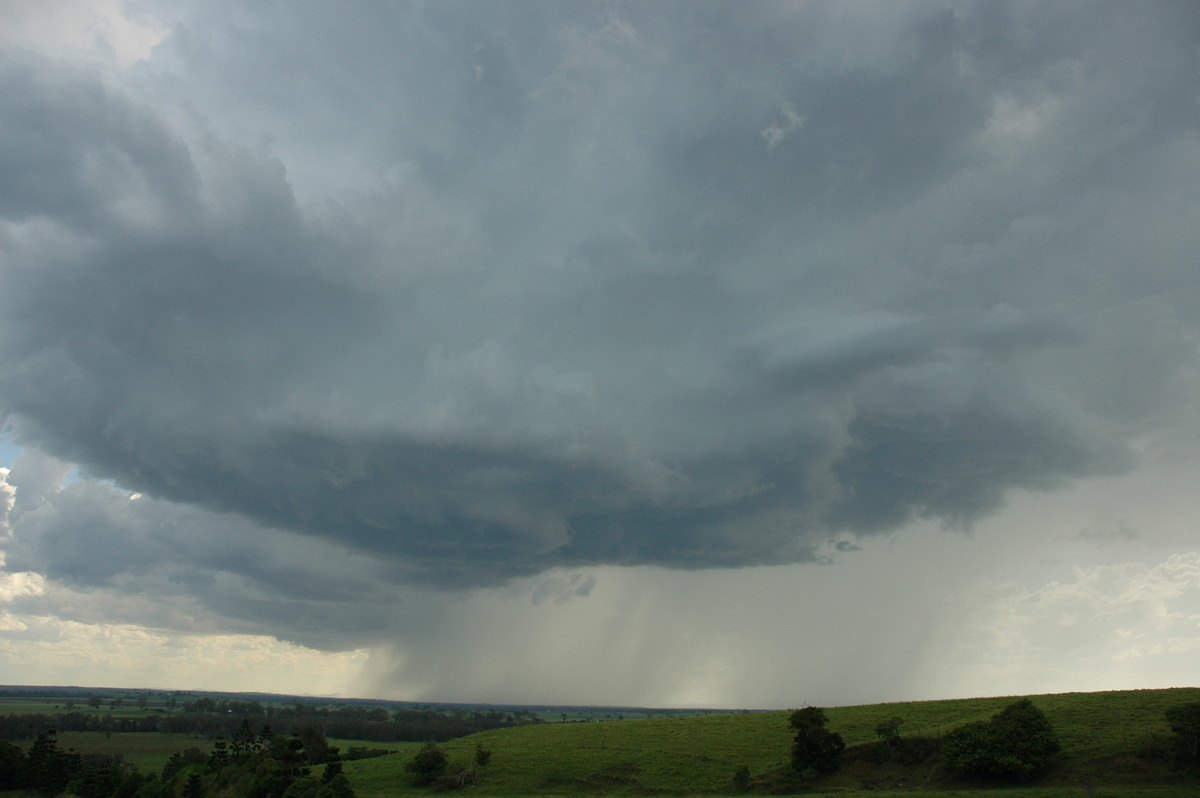
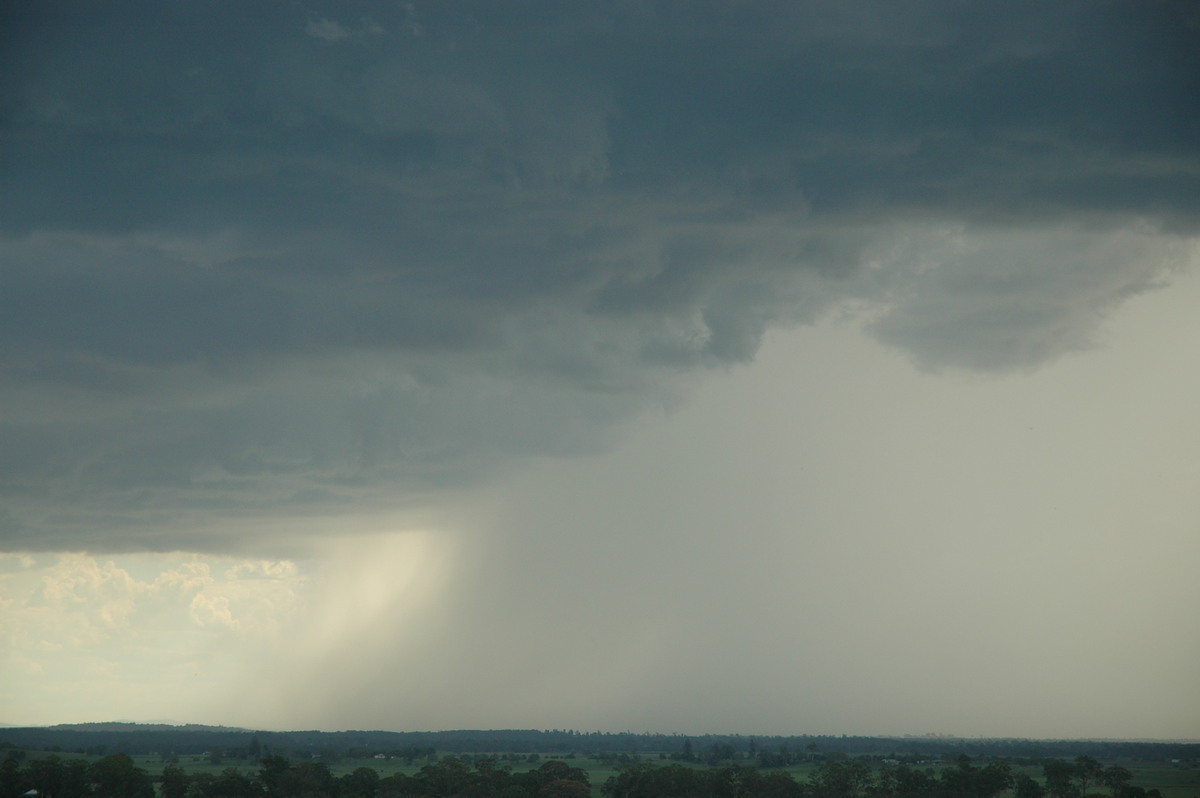
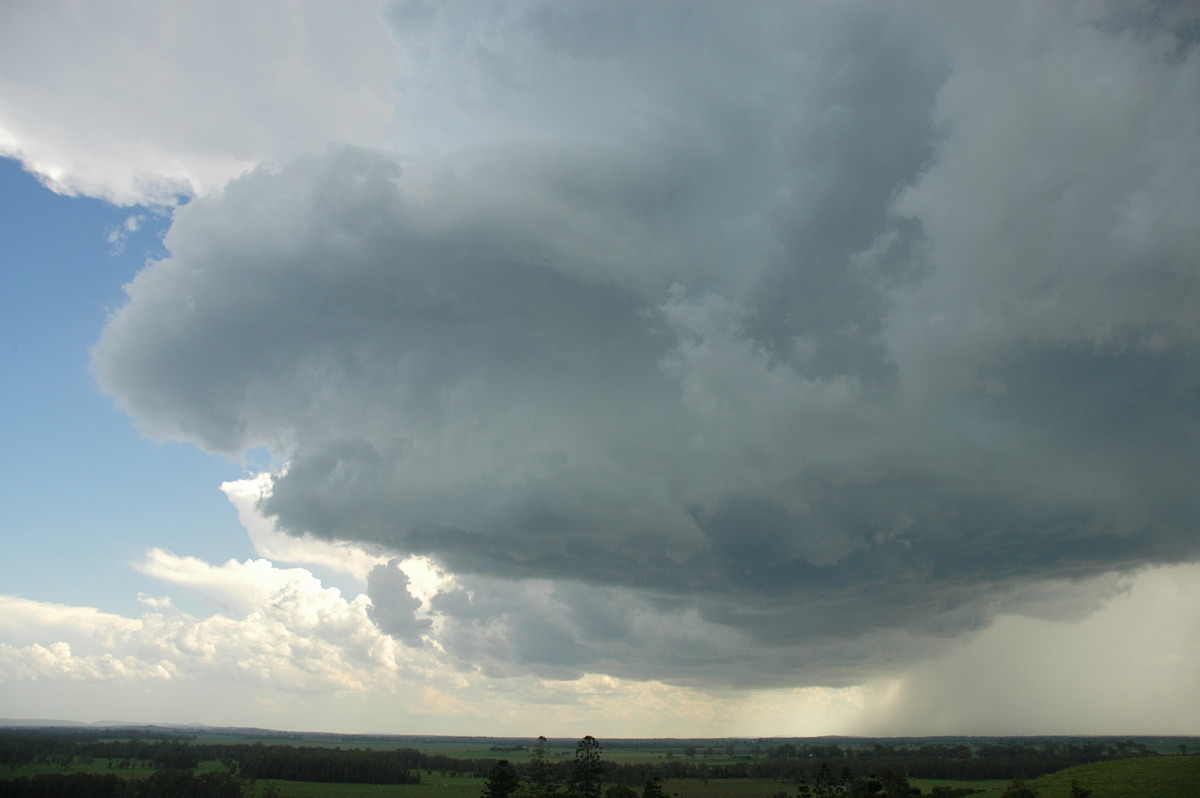
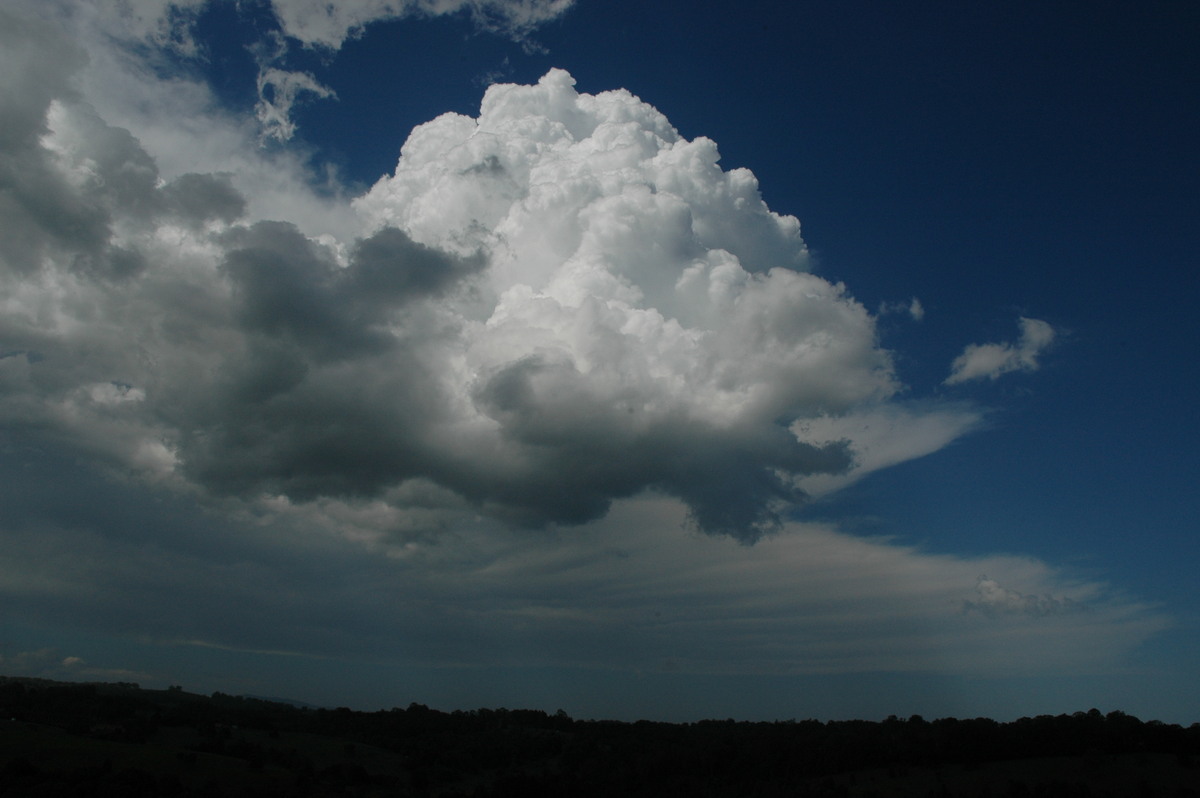
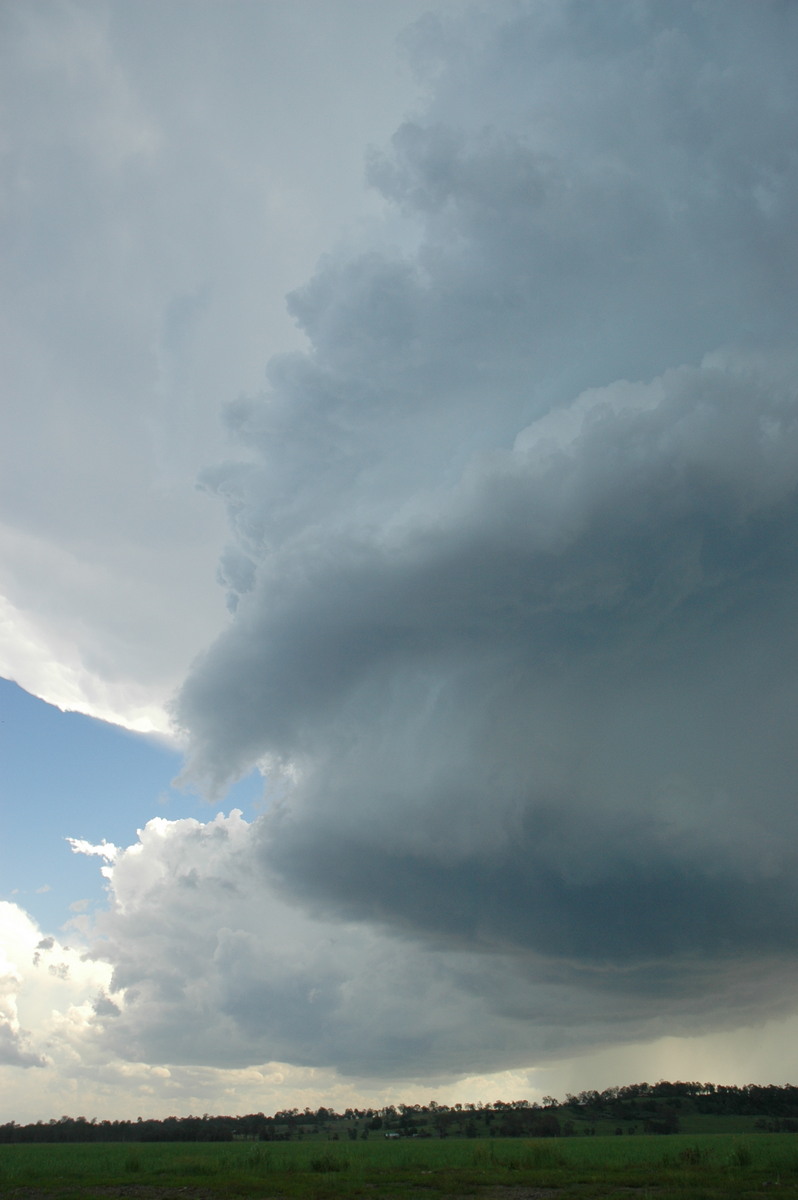
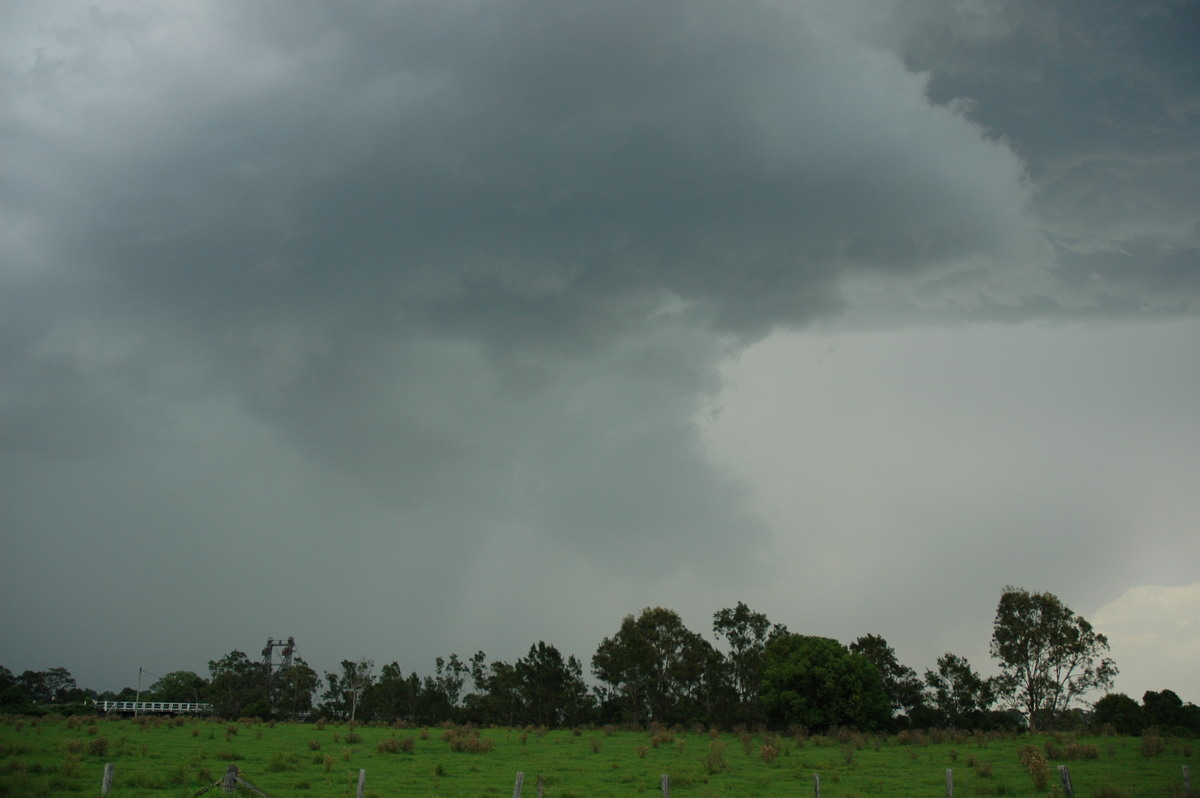
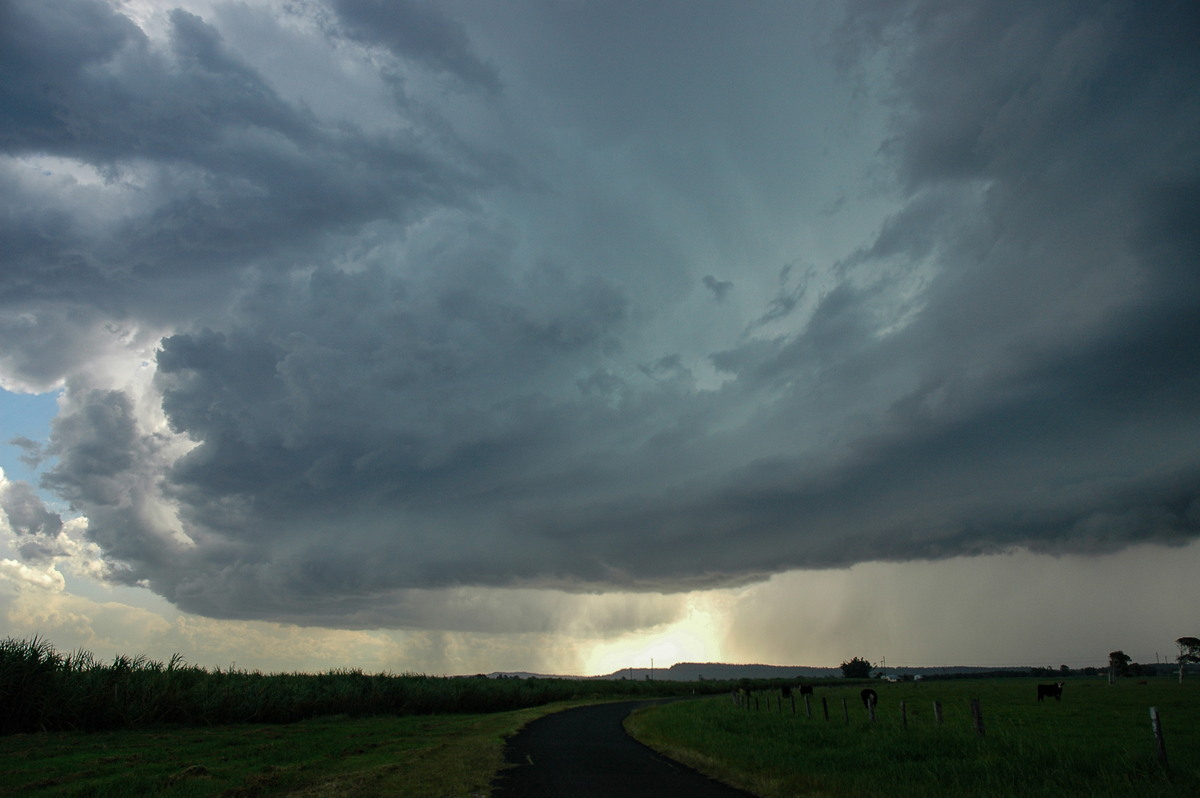
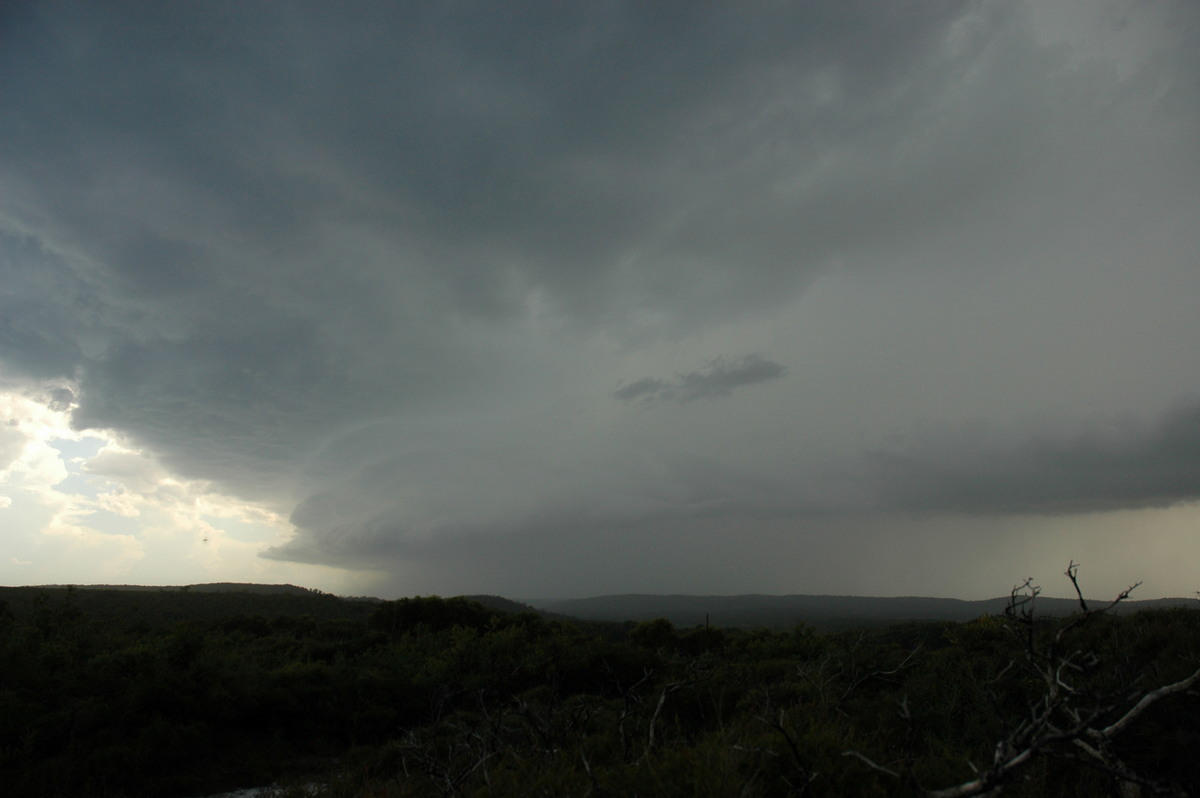
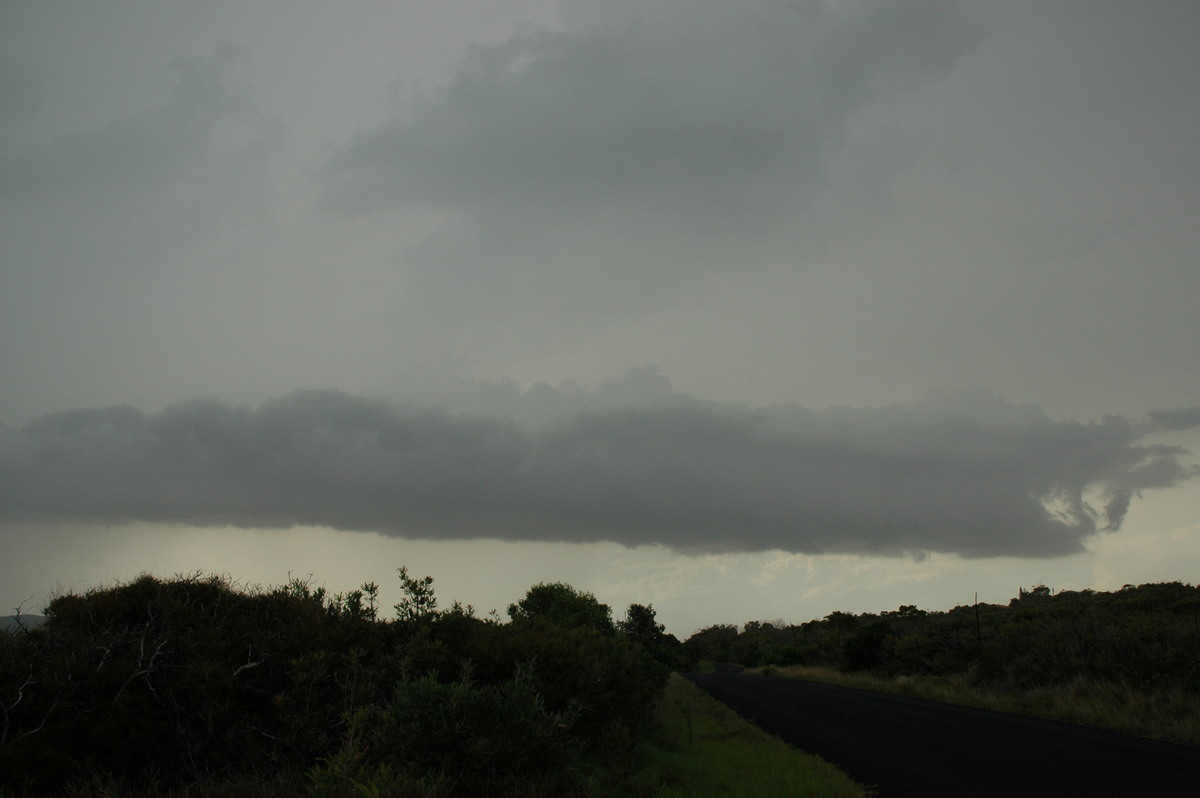
We had to move southeast as quickly as possible so chose the Woodburn Road which goes via Coraki. The storm was very close so it was a bit frustrating not being able to get decent shots of the whole structure, although it still looked amazing from our vantage points. It very soon had a severe appearance and there was evidence of rotation in the base.
We pressed on, stopping very briefly at Coraki and giving the SES another update. The precipitation was only a couple of ks away and I had no intention of my newly hail repaired car getting slammed again so soon !
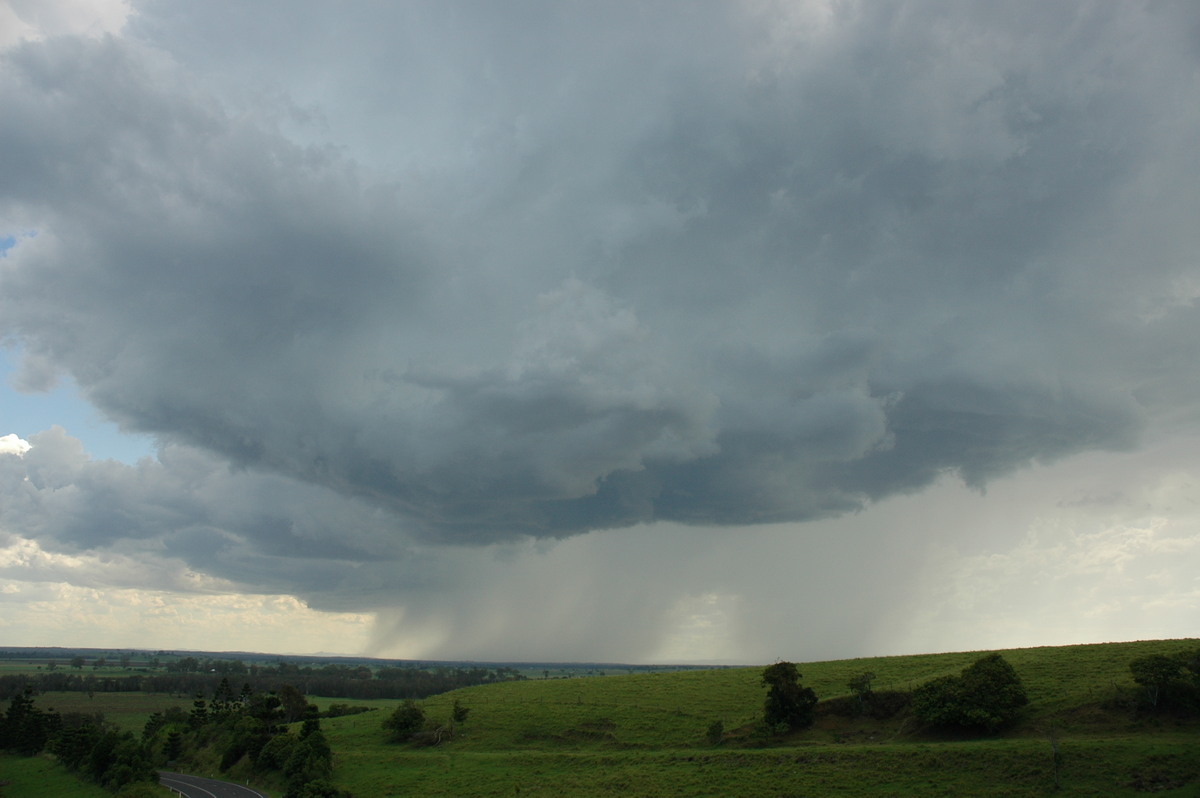
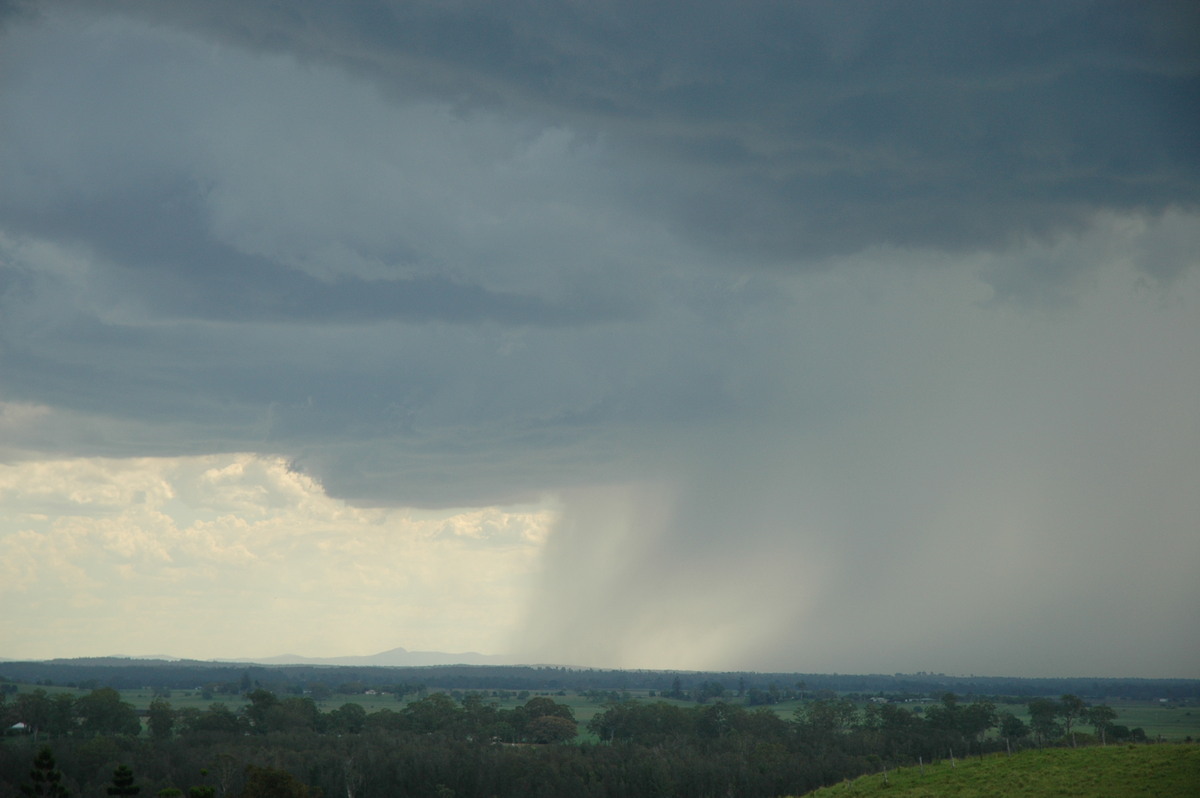
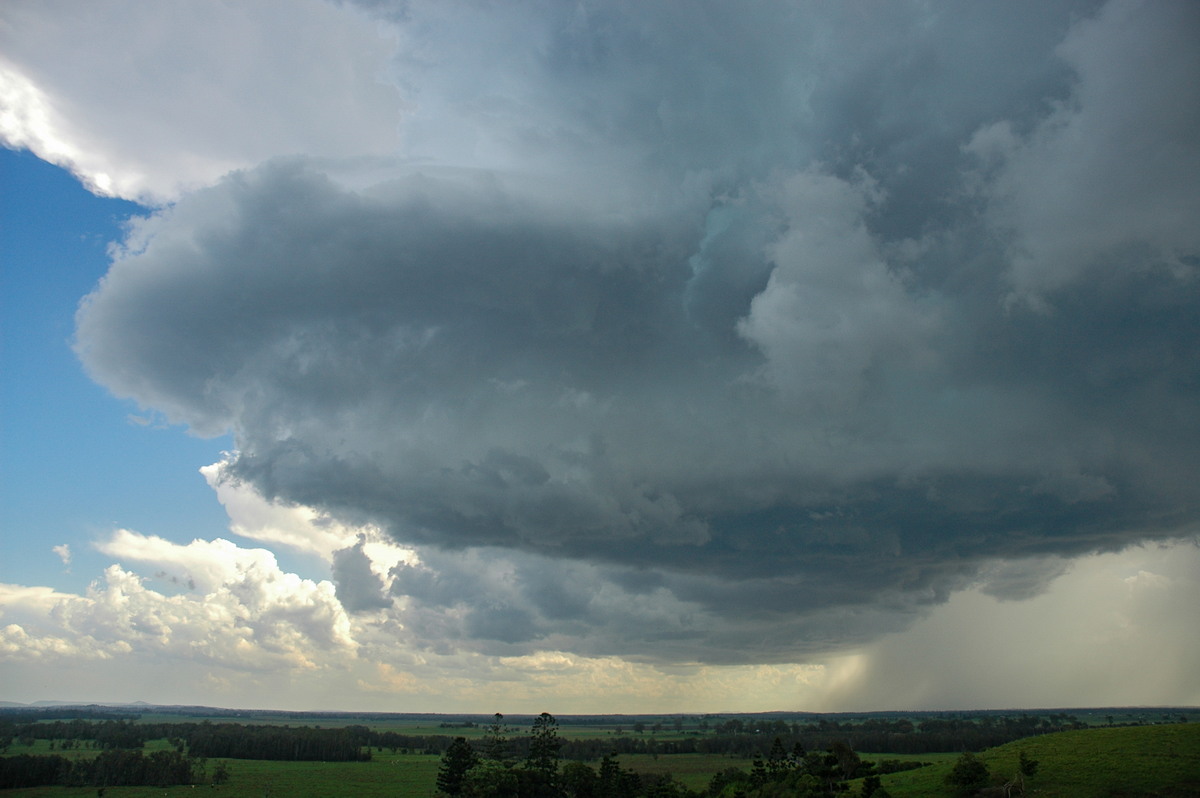
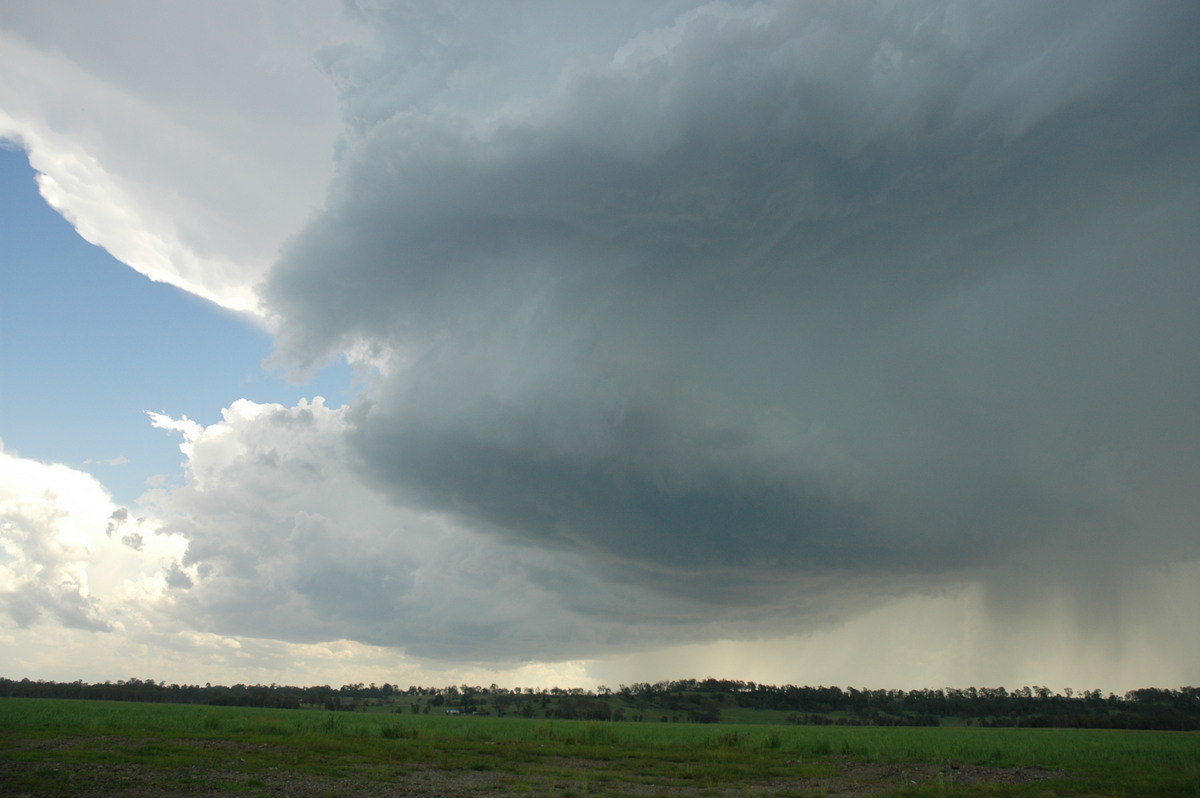
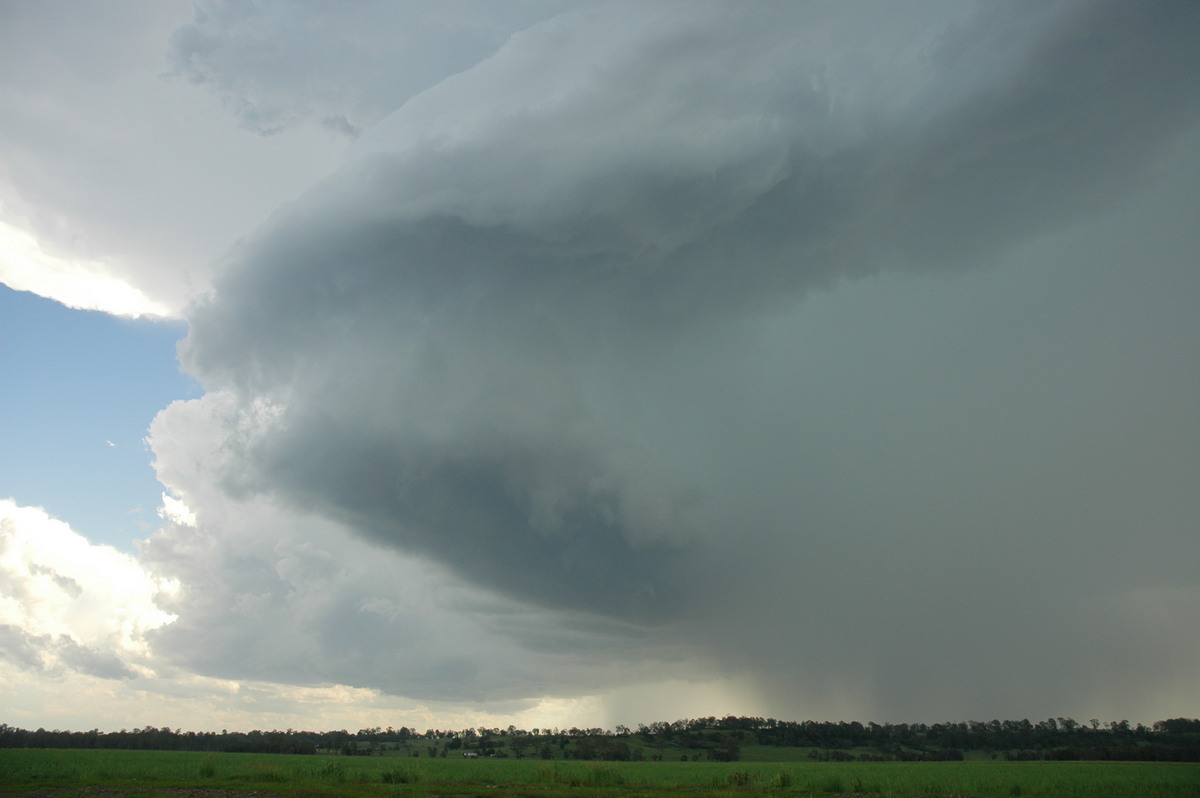
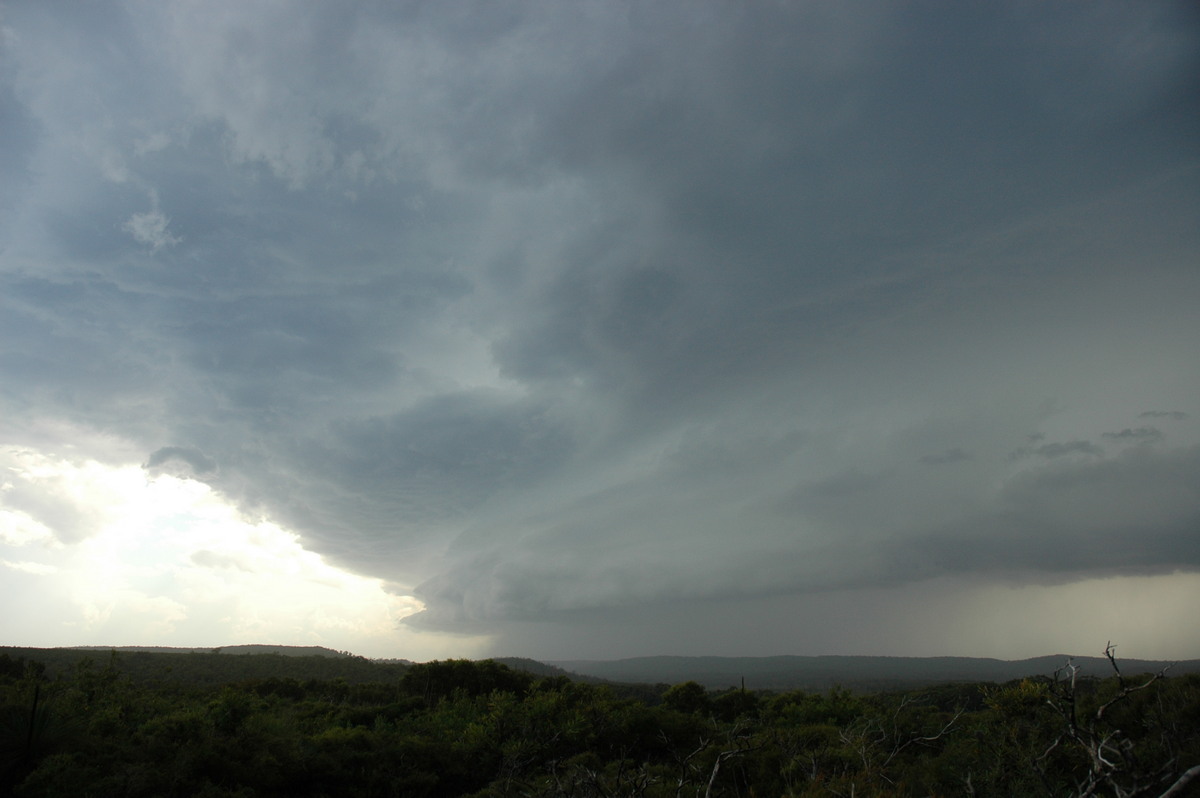
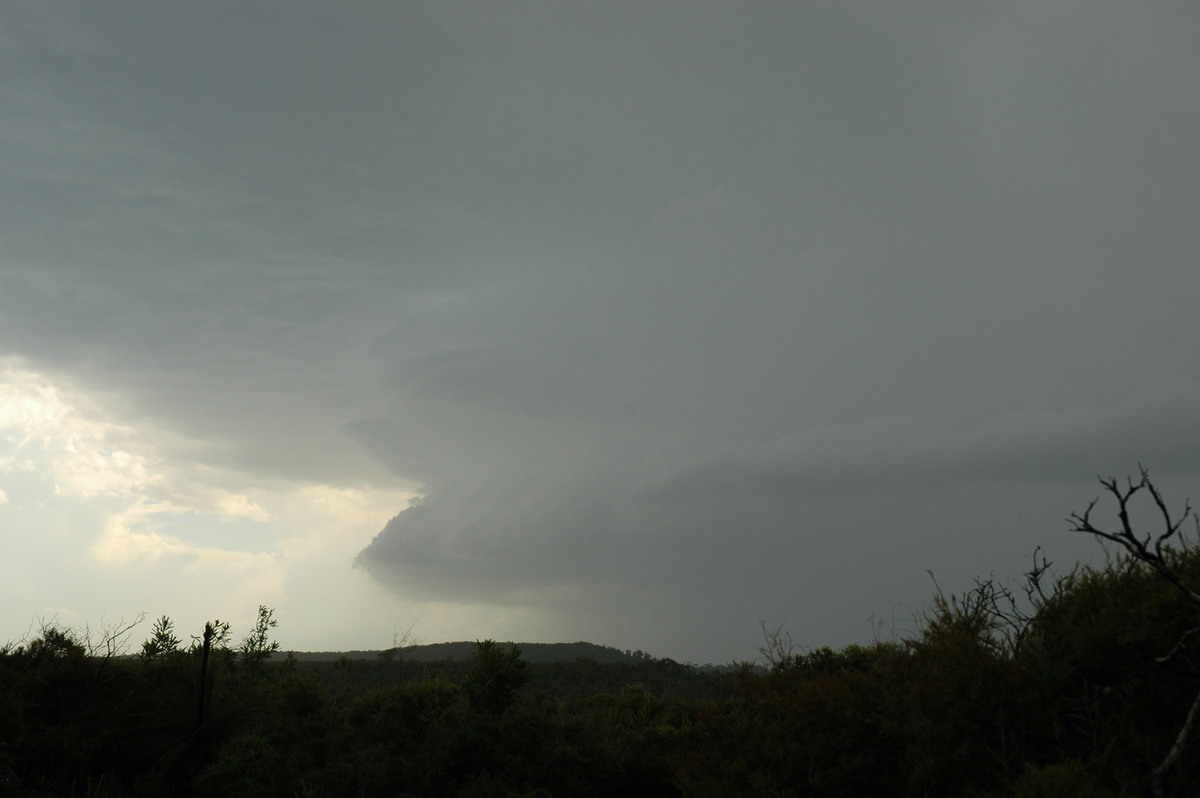
We got to Woodburn with huge raindrops falling. The storm still looked severe with a hail shaft observed to the WSW. We figured the storm core would pass to the south of the area but rain from the northern flank was rapidly approaching.
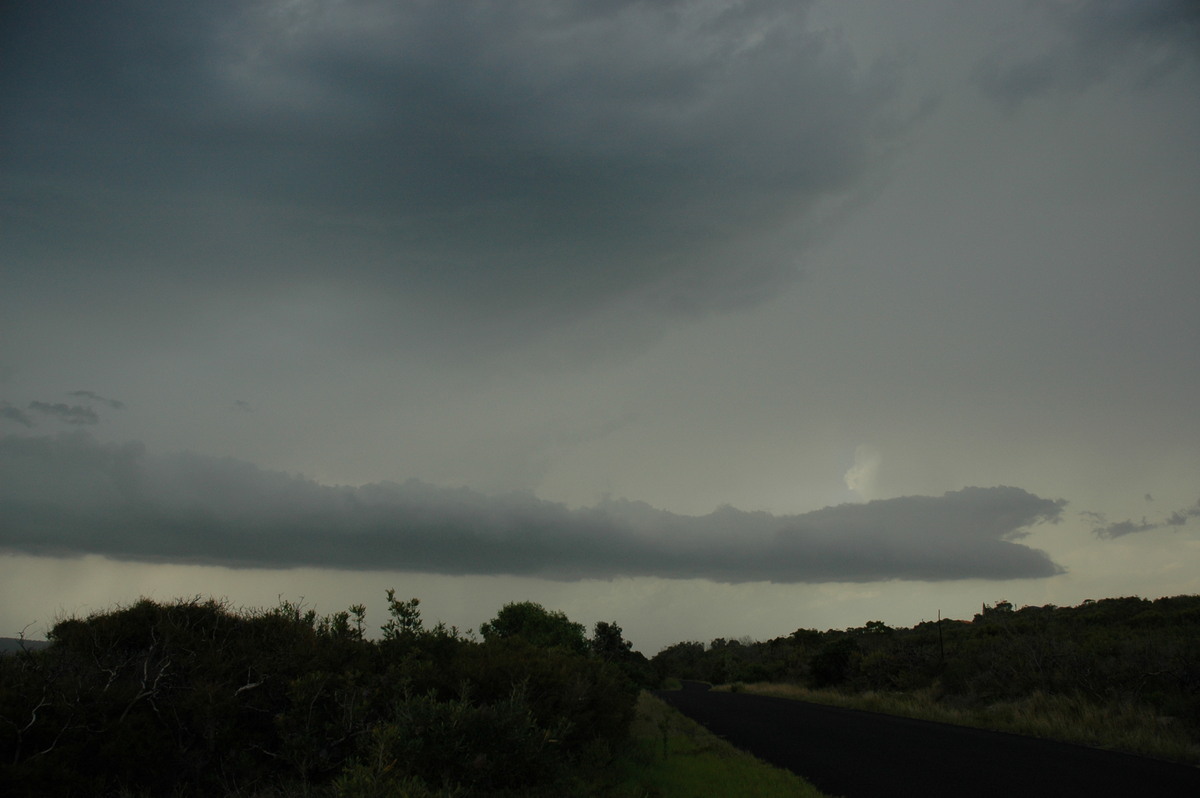
Rodney decided to go north on the Pacific Highway while Dave and I shot E to Evans Head. We gained a great view of the storm as it passed north of Maclean. Later reports revealed golf ball sized hail had hit the Pacific Highway near the Iluka turn off.
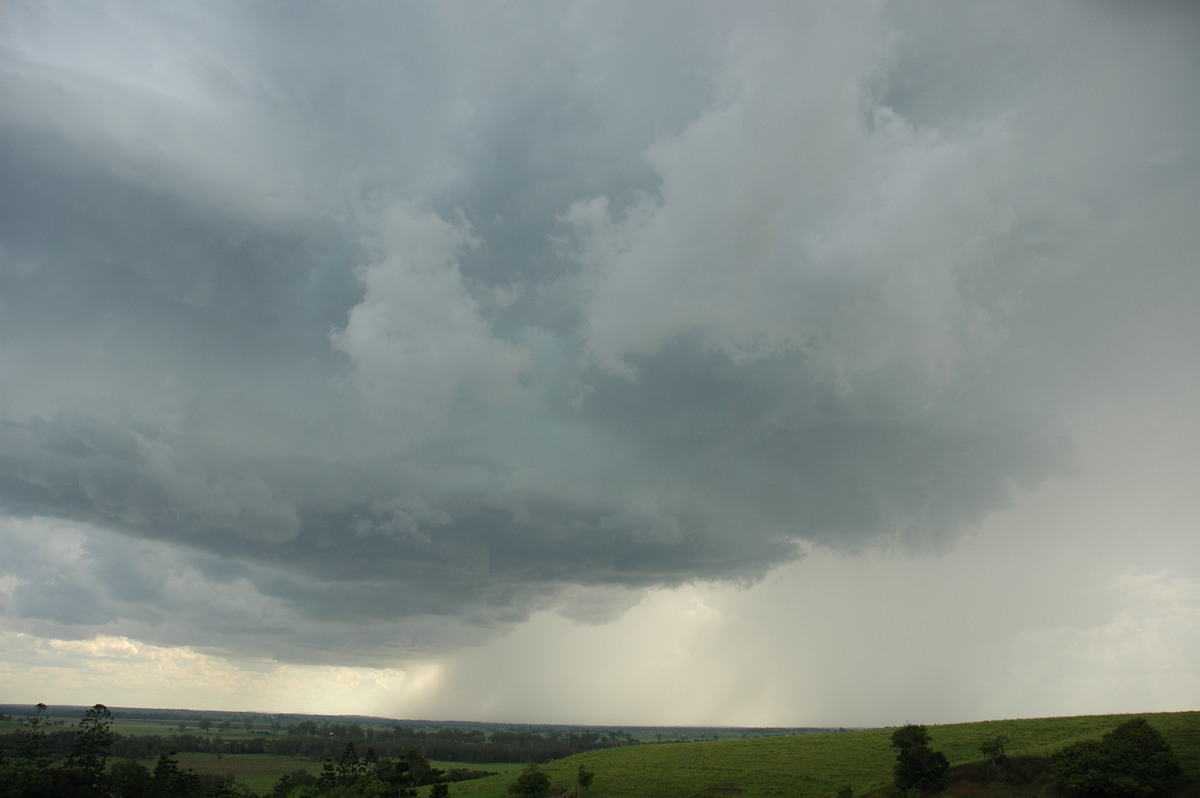
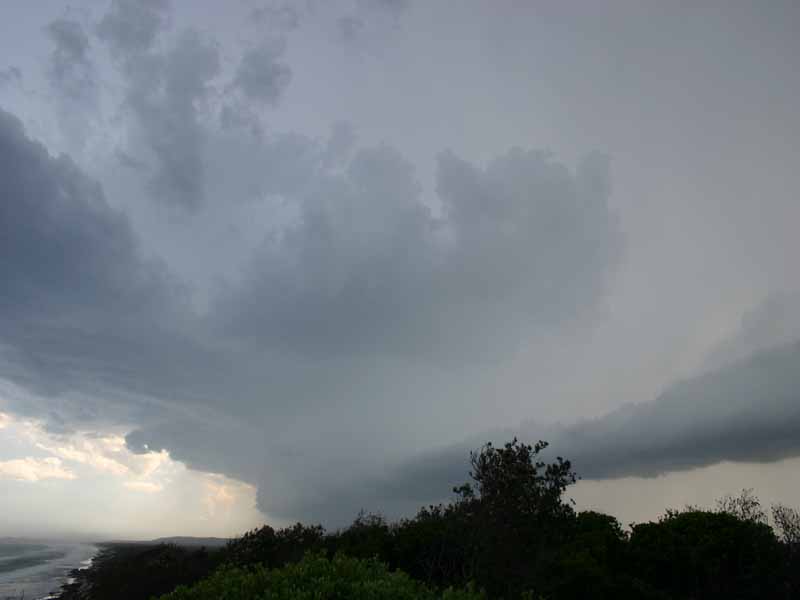
These two photos were taken by Rodney from Broadwater looking south:
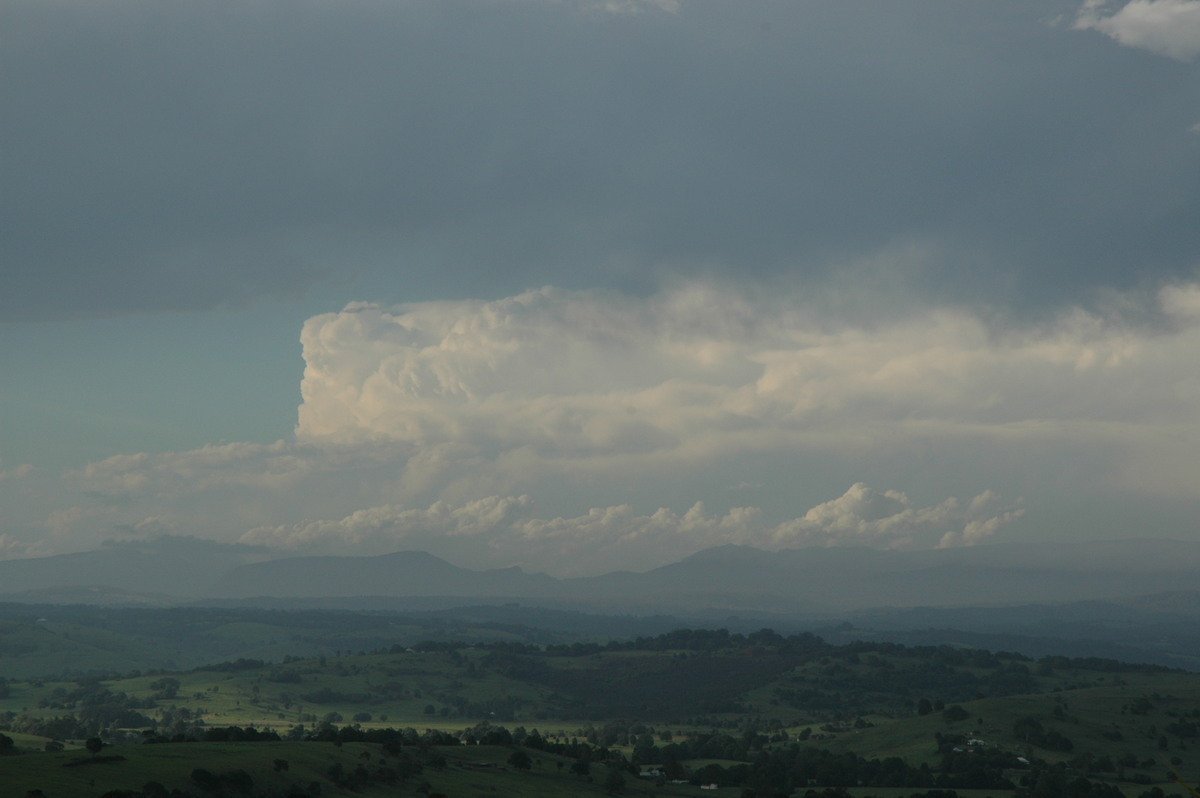
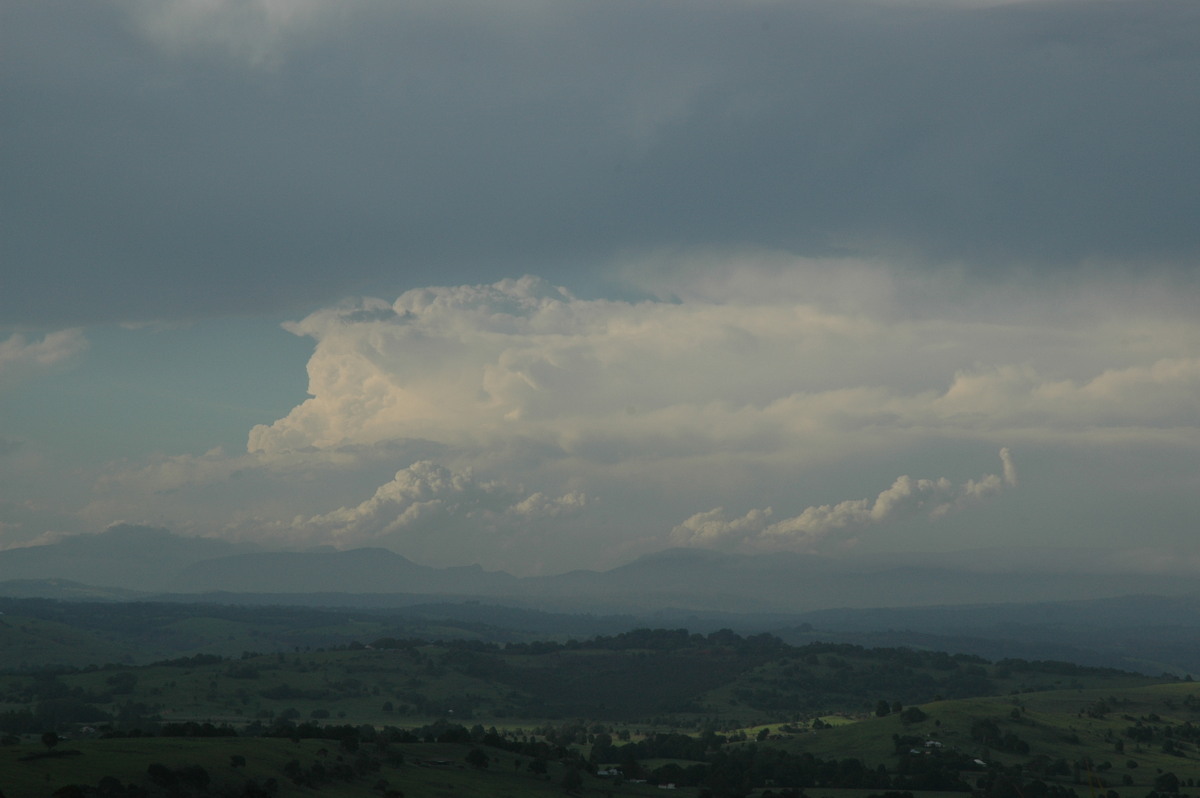
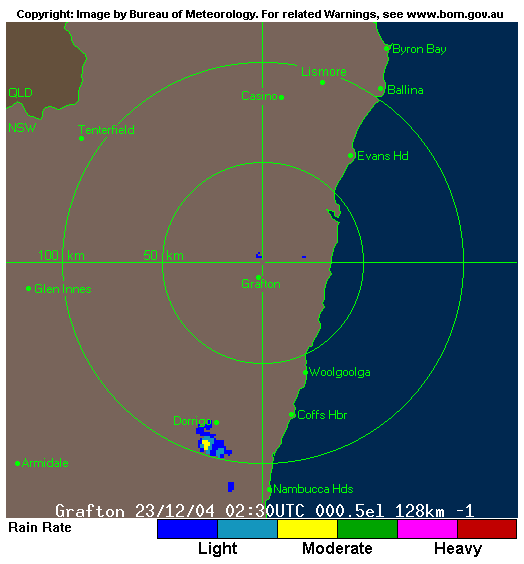
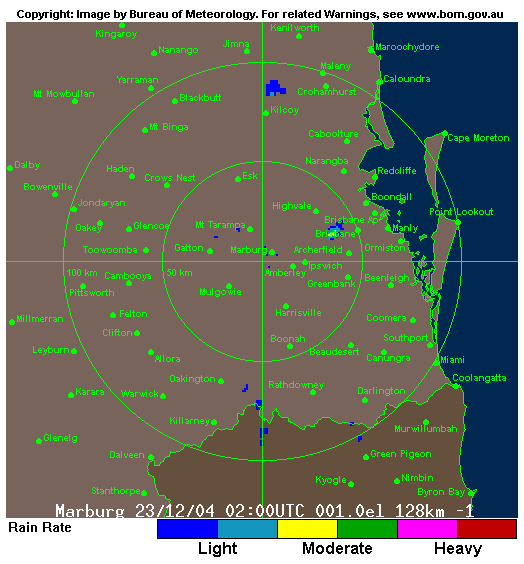
We returned home as other storms in the area began to weaken. The Ipswich supercell was visible to the north.
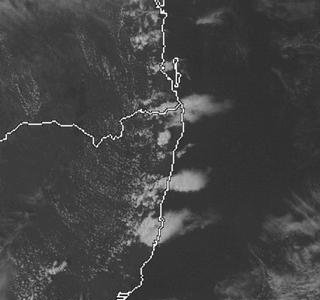
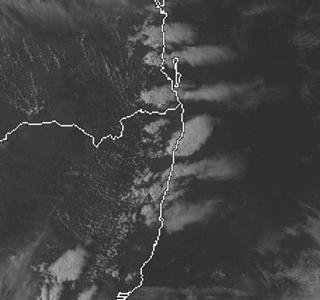
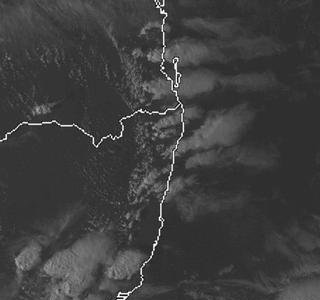
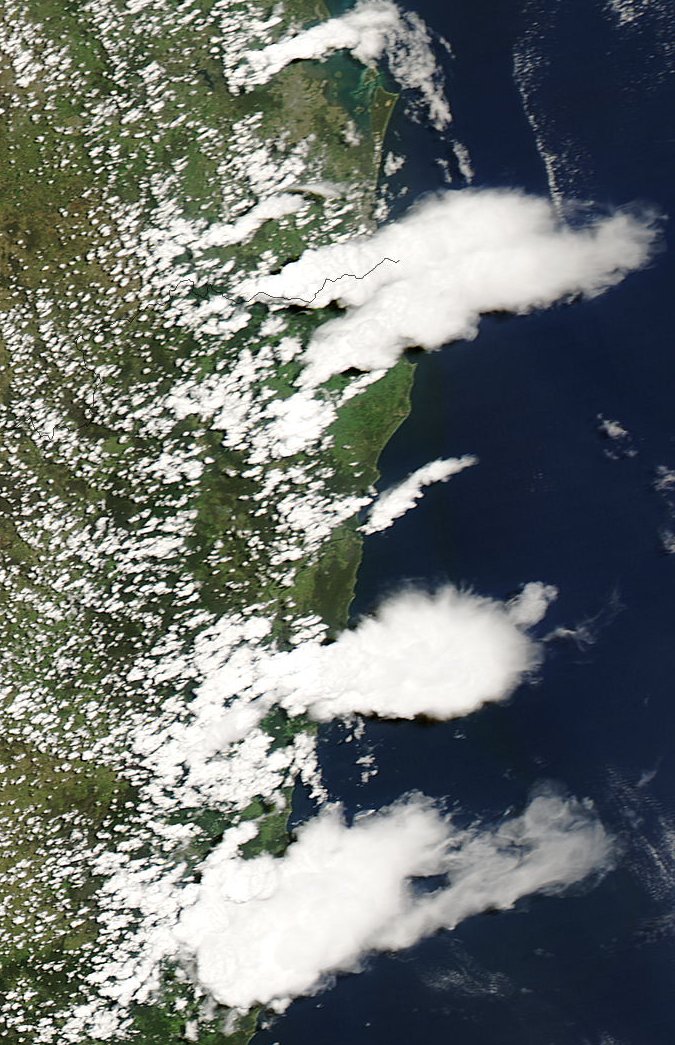
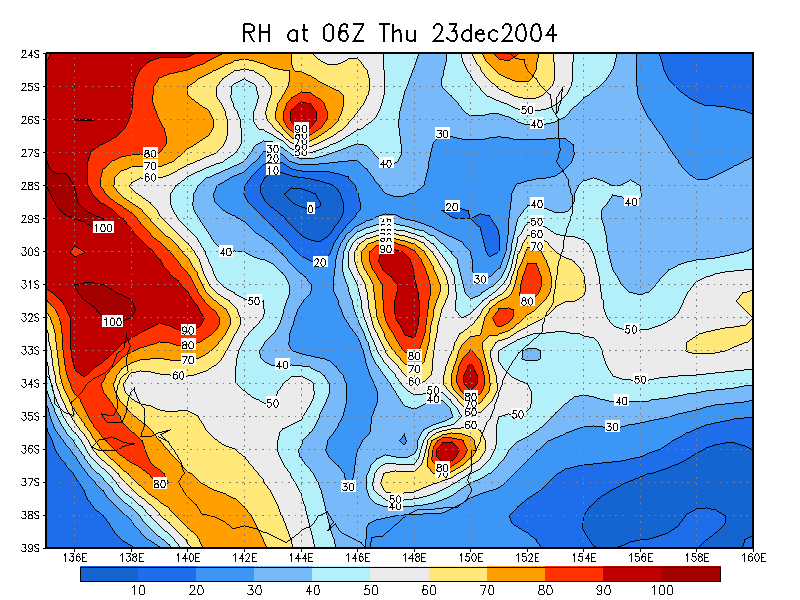
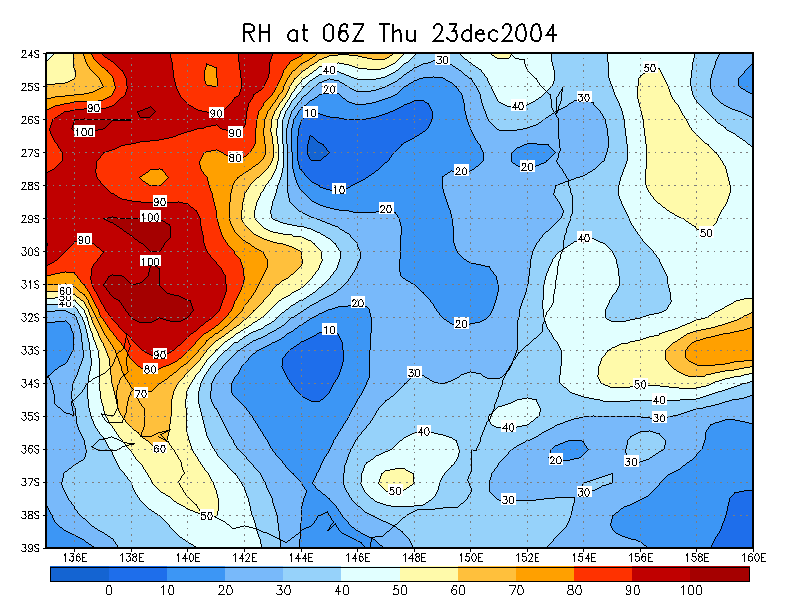
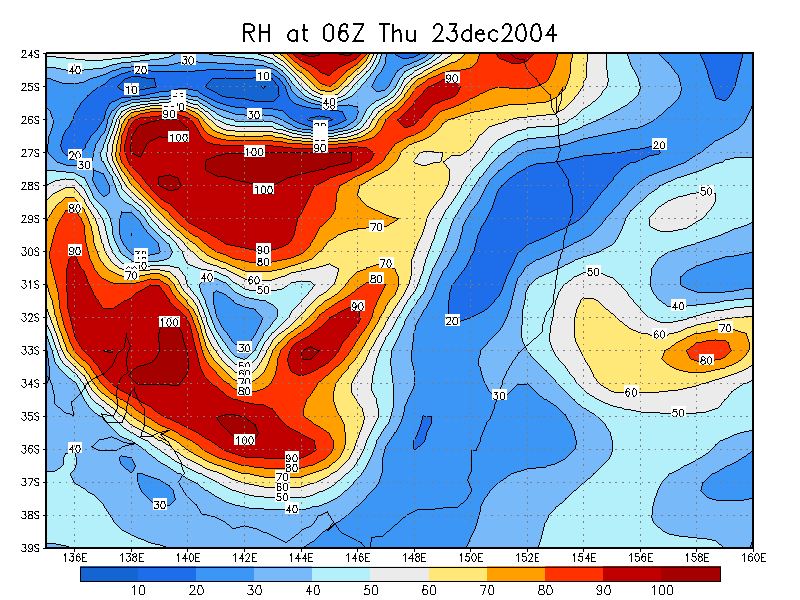
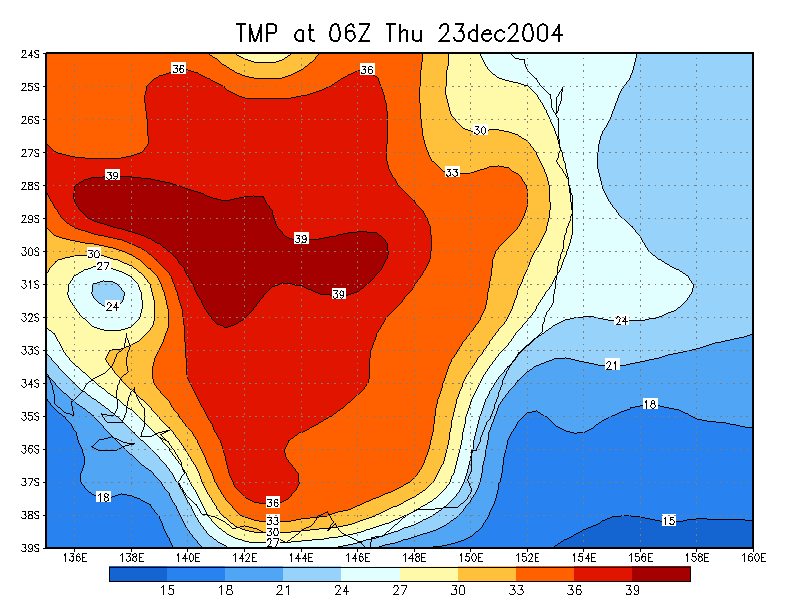
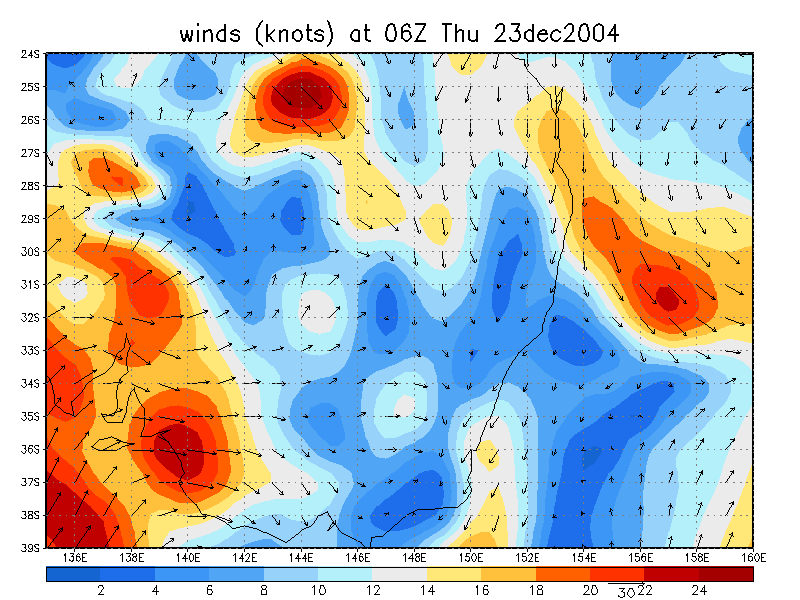
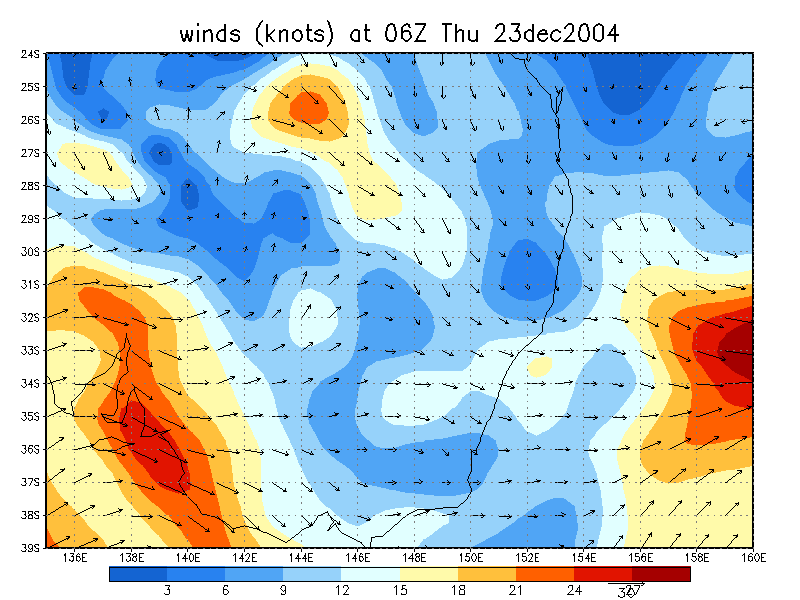
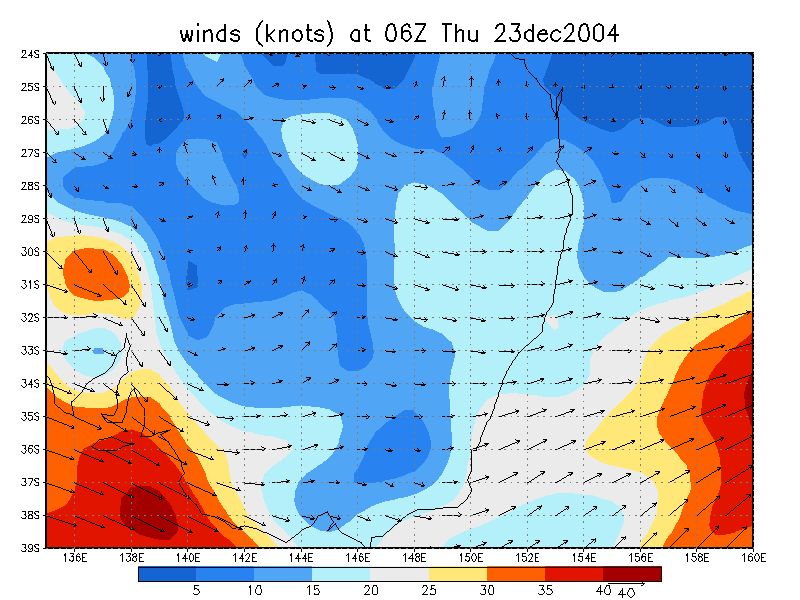
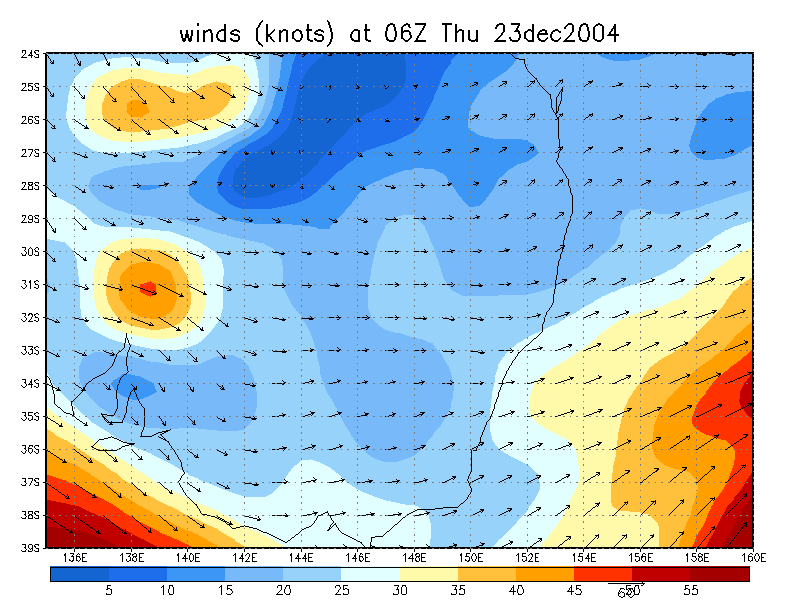
From Weatherzone
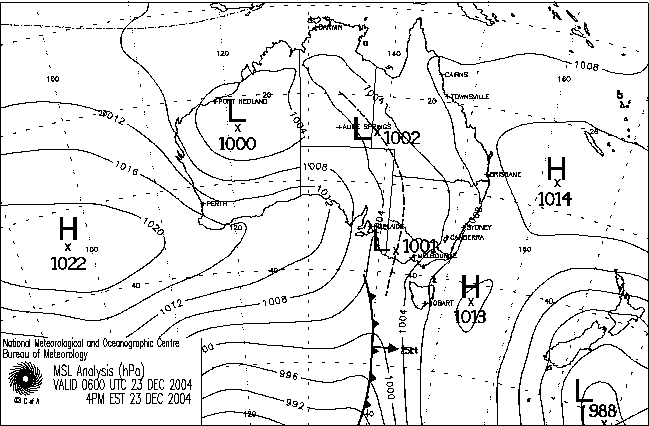
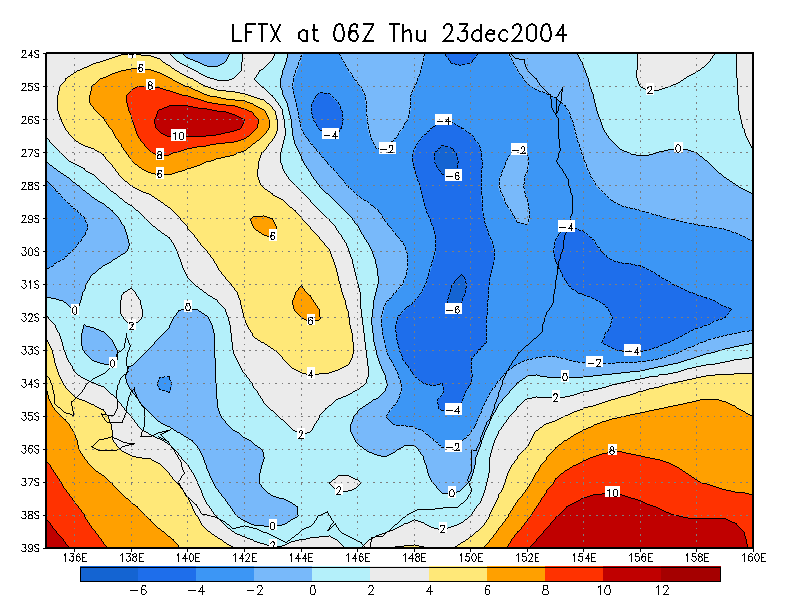
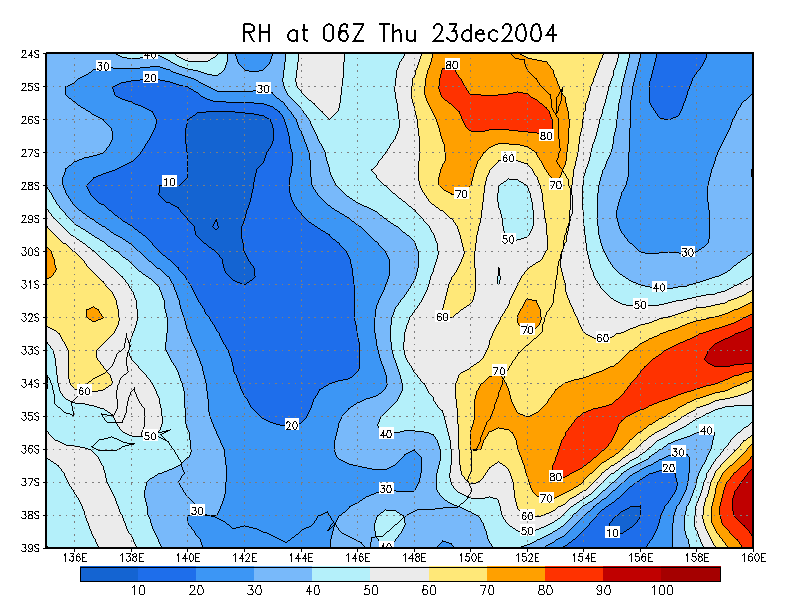
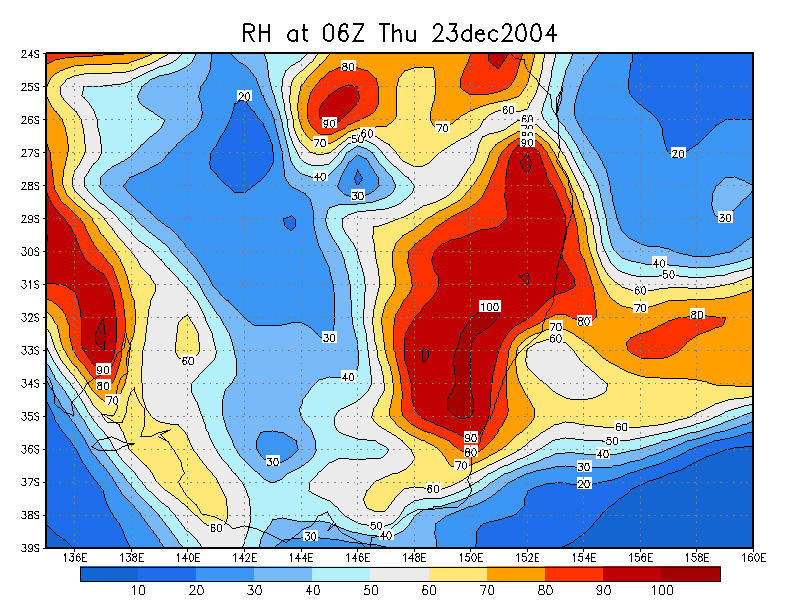
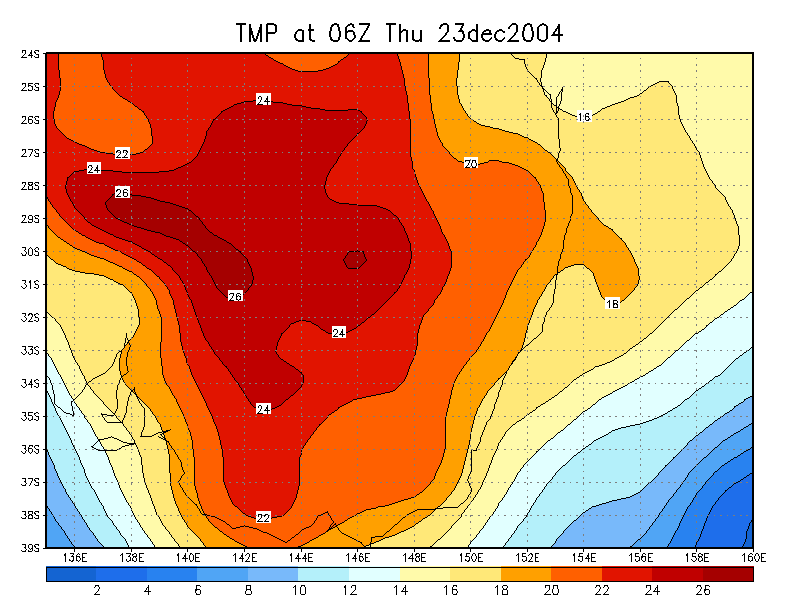
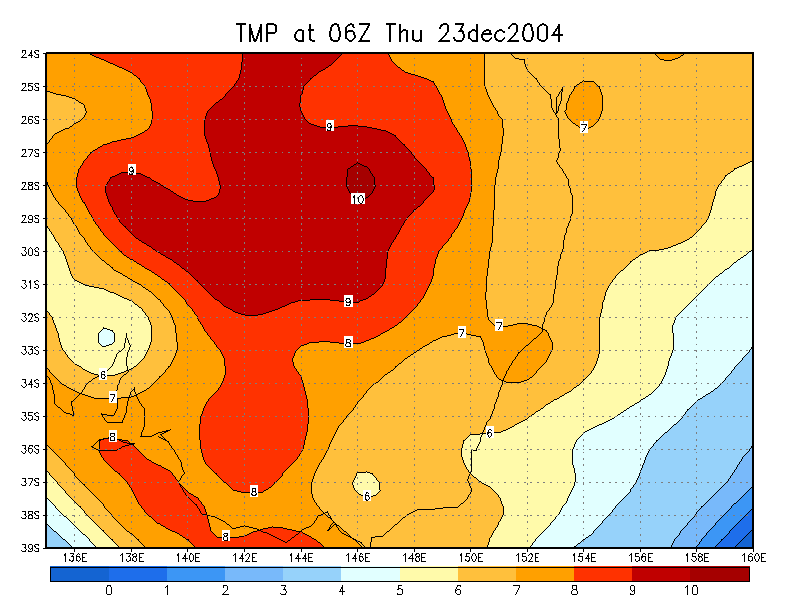
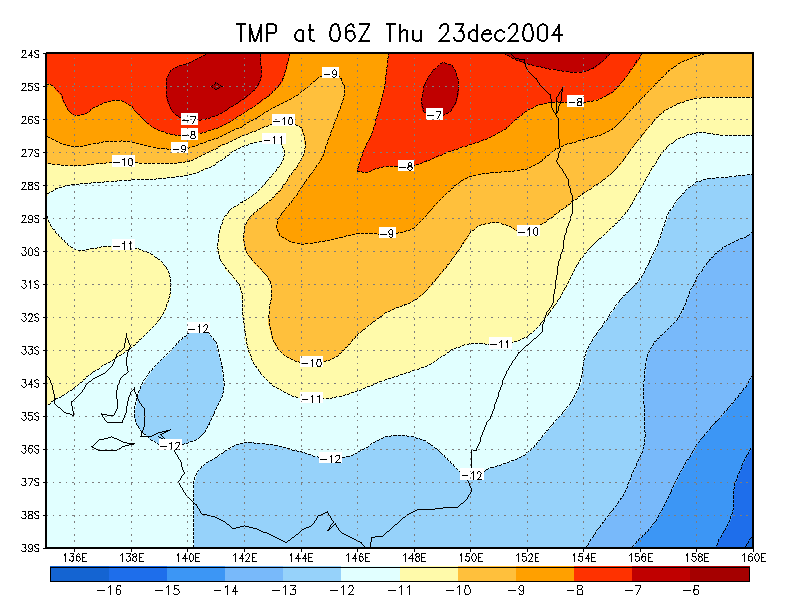
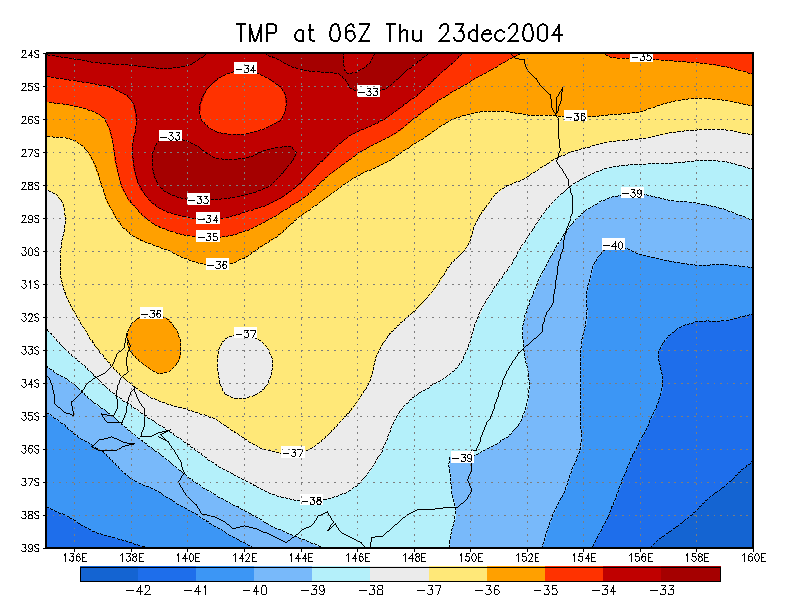
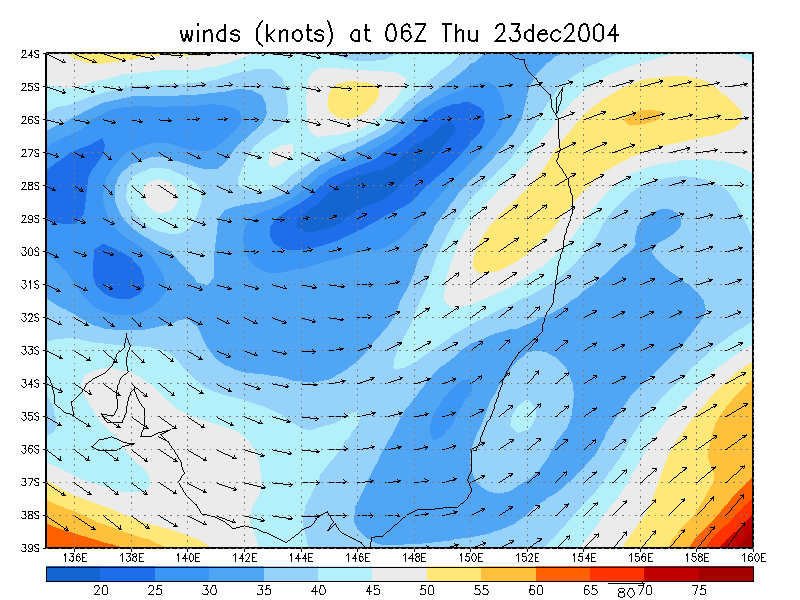
From NOAA 23/12/2004 06z analysis run
|
Document: 200412-05.htm
Updated: 18th January, 2005 |
[Australian Severe Weather index] [Copyright Notice] [Email Contacts] [Search This Site] |